academic tutor

Response Time

98%

31127

Tutor Profile

Subjects

English, Finance

Business Finance Case Studies 1

Q1.

  1. MYOB will receive $1,094,117.28 now, after the discounted installment contract.
  2. The annual operating revenue after 5 years for MYOB will be $720,264,069.60
  3. MYOB would pick the loan option with the lowest EAR, which is option C 5.54% compounding daily @ 5.4%.

EAR- A: 5.58%

EAR- B: 5.57%

EAR- C: 5.54%

  1. Quarter payments are $12,699.93, the loan is amortized on monthly payments, with quarterly compounding of interest which is adjusted accordingly.

Principal

420,000

Interest rate (monthly) - After Compounding Adjustment

0.321%

Term (months)

120


Repayments per month:

4,223

Repayments per Quarter:

12,699.93


  1. The Yield to Maturity on the bonds is 5.356%.
  2. The Coupon Payment is $35.

Q2.

  1.  

Expected Return =YTM(Risk-Free Rate)+(Beta x Market Rate Premium)

Expected Return-MYOB = 1.9%+(0.36x6%)

Expected Return-HYPO = 1.9%+(-0.2x6%)

Australian Bond-10yr-05/04/19

1.9%

Beta 5Y-MYOB

0.36

Hypothetical-Company-Beta

-0.2

Market rate premium

6%


Expected Return-MYOB

4.06%


Expected Return-HYP

0.70%

b.

Weighted Average

Portfolio Return = (Return x Weightage) + (Return x Weightage)

Portfolio Return = (4.06%x 50%) + (0.70% x 50%)

Portfolio Beta= (Beta x Weightage) + (Beta x Weightage)

Portfolio Beta= (0.36x 50%) + (-0.2 x 50%)

Portfolio Return

2.380%

Portfolio Beta

0.08

Q3.

Risk and return are the contrasting concepts in finance and a comparative analysis between them can result into a deep analysis on the investment, as for an investor the term risk is the chance that an investment's return will deviate from what is expected, this can be analyzed by standard deviation, return on the other hand which is the driving force for any investment can be calculated by the Lets first analyze the returns. The lower the level of risk the potential return is likely to be low as well; the higher risk is associated with high returns it is called the Risk-Return Tradeoff.

Return tradeoff

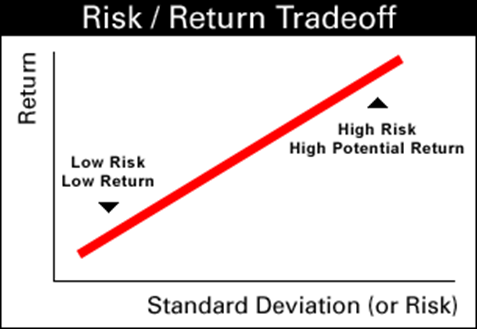
Different investors vary in tolerance level for the risk they are willing to take, some investors will invest in only a low-return investment where the risk is also low, and other investors are willing to take high risk in pursuit for attaining a high return with the risk of losing their entire investment looming.  The bottom left corner of the graph shows that there is low risk in the investment, mostly low-risk low return investments are government bonds, or government issued instruments which can be nearly considered as risk-free investments.

The top right portion of the graph indicates the high-risk instruments or investments which yields high returns or high loss in capital.  These risks can be minimized by portfolio investment, but it all depends on the expected required rate of return for the investor.

The organization MYOB provides cloud business management software solutions with a product diversification of over 50 ranging from payroll, accounts, tax, etc. MYOB has been constantly gaining on its revenue and profit. The share price historical data indicates that the organizations stock has a low risk with low returns. The Australian application software industry has 4 major players Wisetech Global (with a 5Ybeta of 1.72) leads the race amongst the competitors following t is Technology One (with a 5Ybeta of 0.46), the third major player is IRESS Limited (with a 5Ybeta of 0.43) and the fourth in list is MYOB Global (with a 5Y beta of 0.36), beta shows a clear reflection that how the industry is maneuvered by the volatility and the relationship of the stock with the market. Wisetech has a more volatile relationship with the market having a beta above one whereas rest of the three major players are less volatile than the market, which means that MYOB global is not affected greatly by the market movement. With data of market premium and risk free rate, the expected return for MYOB is 4.06%, a combination with a more volatile investment like Wisetech Global can make a balanced portfolio the expected rate of return would be 12.22%, and the combination will have a portfolio return of 8.14% with a Portfolio Beta of 1.04.

The diversification within an industry can prove to be substantial as all the external risk factors to these investments would be the same. There will be no additional risk involved in this portfolio. There is a high return chance of obtaining a profit on investment by sticking into this industry, the trends of this industry show phenomenal growth, the organizations are now migrating towards cloud solutions, MYOB can prove to be a major player with the increasing demand from the industry.

Risk management is vital for investor or organization to make efficient decisions on investment. There are different types of risks

  • Economic Risk

Overall impacts the economy as a whole, conditions can be normal to boom and recession. There can be inflation or deflation, changes in employment and interest rate.

Read More

  • Industry Risk

Impacts are limited to the industry as a whole, economic factors, law changes, import/export restrictions are some of the examples of the industry risk.

  • Company Risk

Impacts only the company and its economic environment labor relationship, inventory management, and financial reputation are some of the examples of the company risk

  • Asset Class Risk

The impacts are limited to the markets they trade in, their performance and risk affecting the whole market of similar products.

To measure risk there are two risk view

The behavioral risk view is measured using:

  • Sensitivity analysis

It determines how other values of variables will affect a dependent variable under fixed circumstances. This analysis helps to understand the impact of a single independent variable effects, for example, the changes in interest rate changes affecting bond prices. It focuses on “What if” of the market and effects.

  • Probability distribution

When there is more than one possibility of the outcomes, the sum of the probability of each outcome can assess the risk.

The statistical risk view is measured using:

  • Standard deviation

It measures the deviance of returns from the mean over time, a higher deviation indicates a risky investment.

  • Coefficient of variation

It measures the total risk per unit of return of an investment, by dividing the standard deviation from the expected rate of return of the investment. Investors want to minimize their risk, the coefficient of variation reflects on a standardized measure of comparing risk and return of other possible investors. The lowest coefficient of variation would reflect an investment which is closed to the requirement of the investment.

For this trade-off let's calculate the annual return with the historical data of MYOB, by calculating the current yield and capital gains/loss

Total Return = (Dividend per Share + (Price at year end – Price at year start)) /Price at Start

Annual Return = ((0.0575 x 2) + (3.36-3.62)) /3.36 [1]

Annual Return = -4.315%

This return was calculated on historical data, calculating the future expected return requires considering different possible returns in alternate market conditions and assigning a probability to each scenario

Market Conditions

Estimated Share Price

Estimated Dividend

Return %

Probability

Return x Probability

Boom

3.8*

0.14***

8***

0.1***

0.8

Normal

3.4[2]

0.115[1]

2***

0.8***

1.6

Recession

3**

0.08***

-4***

0.1***

-0.4


2%

* Historical Data High in 2 Years

** Historical Data Low in 2 Years

*** Hypothetical Data

 To understand an investment opportunity an investor must assess risk, it is a situation where the probability distribution cannot be identified with certainty.  There are many types of risk which are to be evaluated

Assessing the risk is the volatility of the stock, to measure how many the returns changes over a period of time, to measure MYOB we extracted the data for the last year (monthly changes) and applied the standard deviation on it [2].

Date

Close

Capital Gain

4/30/2018

2.81


5/31/2018

2.89

2.847%

6/30/2018

3.13

8.304%

7/31/2018

2.96

-5.431%

8/31/2018

3.02

2.027%

9/30/2018

3.37

11.589%

10/31/2018

3.46

2.671%

11/30/2018

3.36

-2.890%

12/31/2018

3.39

0.893%

1/31/2019

3.41

0.590%

2/28/2019

3.33

-2.346%

3/31/2019

3.4

2.102%

4/12/2019

3.4

0.000%


Standard Deviation


4.642%

Co-Efficient of Variation (Expected rate of return taken from Q2.a)

1.14

To measure risk there are further methods to assess and control it like Value at Risk (VaR), it estimates how much an investment will lose with a certain probability, in a certain period of time. It can be assessed to know how the organization in the industry can use the assets to cover the possible losses in the market.

To focus on the volatility of an instrument in comparison with the market for the systematic risk we look at the beta, it gives a picture of how the market trend will affect the stock. Defensive assets are referred to the assets having a beta less than one, aggressive assets have a beta greater than one. The risk-free assets have beta 0 or closer.

It is essential for a investor to grasp the concept of risk versus return, which allows the individual to create a diversified portfolio minimizing risk and obtaining maximum rewards which are unaffected by the risks for a single asset. Past performance of an organization is a reflection of the future performance.

[1] “MYO.AX Historical prices | MYOB GROUP FPO Stock,” Yahoo! Finance, 15-Apr-2019. [Online]. Available: https://au.finance.yahoo.com/quote/MYO.AX/history?period1=1514660400&period2=1546196400&interval=1d&filter=history&frequency=1d. [Accessed: 15-Apr-2019].

[2] “MYO.AX Historical prices | MYOB GROUP FPO Stock,” Yahoo! Finance, 15-Apr-2019. [Online]. Available: https://au.finance.yahoo.com/quote/MYO.AX/history?period1=1397502000&period2=1555268400&interval=1d&filter=history&frequency=1d. [Accessed: 15-Apr-2019].

Get Assignment Help from Me

TOP
×
Order Notification

Limited Time Offer! - 20% OFF on all Services Get Expert Assistance Today!

X