COCHLEAR LIMITED
BUSINESS CASE STUDIES 1
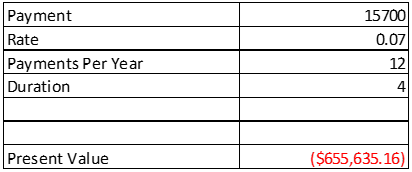
1 (A) Cochlear will receive $655,635.16 for the discount on an installment contract
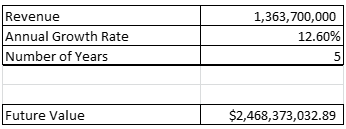
1 (B) Revenue will grow upto $2,468,373,032,89 in 5 years with the annual growth rate of 12.60%.
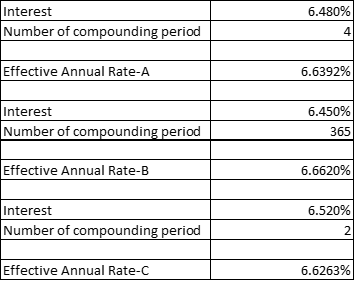
1 (C) Cochlear will choose the lowest possible EAR to borrow fund, which is in option C at 6.62% rate.
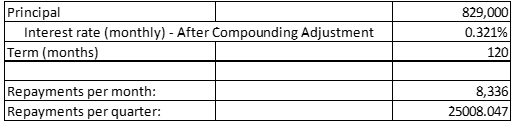
1 (D) Repayments Per month is $8,336 and the quarterly payment is $25008.047 to pay off the principal amount of $829,000 in 10 years.
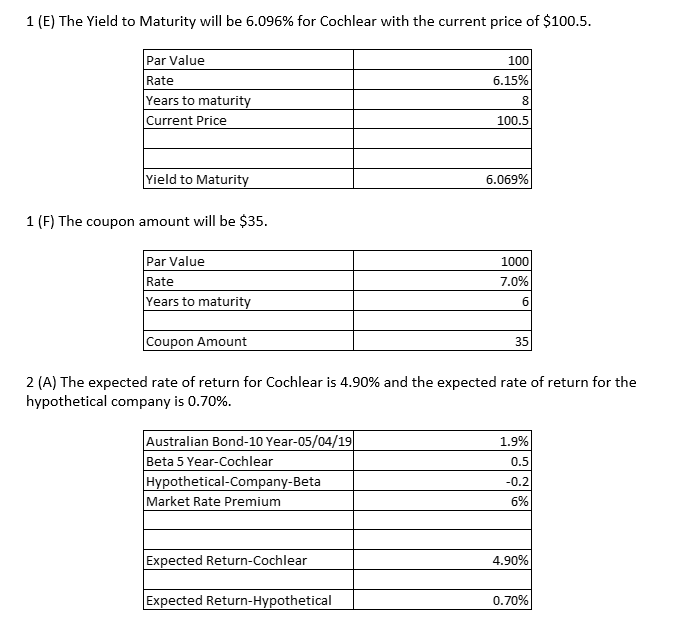
2 (B) The portfolio expected rate of return is 2.8% and portfolio beta is 0.15.

3
Cochlear Limited trading under the name of COH in the Australian Securities Exchange since 1995, it was originally founded in 1981. It is traded in the Health Care Equipment & Services Industry group by Global Industry Classification Standard but focuses on implantable hearing solutions it is leading the globe in this solution (Cochlear). The global players in the industry are Amplifon Hearing Health Care, Arphi Electronics Pvt. Ltd, Audina Hearing Instruments, Cochlear Ltd, Gn Store Nord, Horentek, Med-El, Microson, Rion Co., Ltd., Sebotek Hearing Systems, Siemens Ag, Sonova Holding Ag, Starkey Hearing Technologies, William Demant Holding A/S and Zounds Hearing Inc. The global hearing aid sector is likely to rise with a CAGR of 5.42% over the next 7 years, with factors taken into accounts such as the elderly population, increased use of binaural/bimodal fitting and the rising technology in the industry with heavy investments in research and development (Global Hearing Aids Market Forecast 2019-2027 2018). Cochlear finds itself above the rest of the companies by being in the top 50 companies listed in the Australian securities exchange, where the health care sector has an impact of 9.3% in the overall 50 companies. Cochlear currently has over $10,000,000,000 market capitalization (ASX Top 50 Companies 2019). ASX has seen significant growth in the past quarter and Cochlear has announced a new series of implants which will eventually boost up the share prices (Hall 2019). In the financial world the term risk and return are two sides of the coin but it trade off or risk and return is to be considered very crucial for the investors, many demographic and other factors are taken into account for an investor to decide how much risk tolerance he has and will be comfortable in investing the amount. The term risk is the chance that the return of an investment will differ from the expectation, there are measures to risk like standard deviation, beta, and coefficient of variation, the possibility to gain a heavy return there is a possibility of losing a part or even the whole investment to gain those returns.
Read More
The Risk/Return trade-off can be analyzed two factors are taken into account the x-axis has Risk whereas the y-axis has Return looking at the bottom left part of the graph where the risk is very low and returns are also very low these represent a risk free investment which can be government bond or other federal based investment, as we move along the graph moderate return and moderate risk are usually associated with large cap companies which are usually not that risky due to its solid roots in the market and due to the heavy investment the heavy fluctuation in prices may not be that common, as we reach the top right side of the graph the new companies, small-cap companies, and other high-risk investments can yield high returns (Investopedia Staff). Risks can be categorized into systematic risk and unsystematic risk. Systematic risk is associated with the macroeconomic factors where a corporation has no control over it they are unavoidable and the effect is seen to the market overall. Inflation, foreign exchange rate, political instability, wars, recessions and interest rate variation are some of the systematic risk involved for an investor. The beta of the company is the measure as to how the company’s equity market value changes with the market change. To know the systematic risk of a portfolio or a singular investment beta can be analyzed upon. The company which has 0 beta represent that the security or portfolio is uncorrelated with the market, the company having a negative beta represents that the security has an inverse relationship with the market. The company which has a beta between 0 and 1 indicates that it moves in a similar pattern as the market but with less volatility. The company has a beta of 1 move in the same pattern as the market with similar volatility and is prone to any systematic risk. The companies having a beta greater than 1 represents heavy volatility and are sensitive to many systematic risks (Investopedia 2018). The beta is then taken as a factor in the Capital Asset Pricing Model with factors like risk-free rate and market premium to calculate the required rate of return for the investor. The beta will identify how sensitive security is in comparison with market volatility, the risk-free return is added to have a minimum slab for the return for any investor whereas the market premium is the additional return an investor receives by investing in risky security. The goal of an investor is to find the spot where the investments are moderately risky and returns are on high, or investments are at low risk with moderate returns this can be achieved by diversification of investment to obtain a portfolio. The other type of risk which is unsystematic is mainly concerned with the micro factors within an organization or a sector like regulatory changes, new competition, product recall, unsatisfied workforce. These can be controlled and avoided by the diversification in different classes of assets to construct a portfolio which has minimal risk effect.In the case of cochlear the beta is 0.5 which can be interpreted as the movement will be similar to market but with less volatility, calculating the expected rate of return can paint a picture for the investor as to how the asset will maneuver in the market to land to investors’ expectations, however CAPM can reflect as to how the investors can expect returns, but it does not measure the risk associated with it in a correct manner for that we calculate standard deviation for any security which can show the volatility over a period of time for a specific investment.
To calculate standard deviation we will take the data of the last twelve months of the share price of cochlear (COX.AH Historical Prices 2019). In Table 1 below cochlear has faced a high volatility in the last year having an average price of $187.88 and the average change of -0.36%, both these factor does not reflect the trends and volatility of market, however standard deviation is 7.046% which can be looked on as that the market can sway 7 percent on each side at any given time however even standard deviation alone cannot be claimed as a complete analysis for a portfolio, to compare securities with other securities adding the expected rate of return which is obtained from CAPM gives a complete picture of all factors associated with market, it is calculated by dividing standard deviation from the required rate of return, both these factors account to all factors like beta, market premium, risk free rate, and standard deviation. The coefficient of variation is 1.44. The portfolio addition with a negative beta can be fruitful in an extremely volatile market where an investor can earn from risky investments, having negative beta with a positive beta in the portfolio can severely affect the required rate of return in a portfolio. With the current market trend of ASX it is not advisable that the company with a negative beta should be added in the portfolio it is also decreasing the required rate of return in a heavy manner and the individual investment itself which has a required rate of return of 0.70% is lower the risk-free rate which is not advisable for any investor at all.
|
Date
|
Closing Price
|
% Change
|
|
31-Mar-18
|
$ 194.06
|
|
|
30-Apr-18
|
$ 196.15
|
1.08%
|
|
31-May-18
|
$ 200.17
|
2.05%
|
|
30-Jun-18
|
$ 203.36
|
1.59%
|
|
31-Jul-18
|
$ 215.81
|
6.12%
|
|
31-Aug-18
|
$ 200.64
|
-7.03%
|
|
30-Sep-18
|
$ 177.58
|
-11.49%
|
|
31-Oct-18
|
$ 169.28
|
-4.67%
|
|
30-Nov-18
|
$ 173.57
|
2.53%
|
|
31-Dec-18
|
$ 193.42
|
11.44%
|
|
31-Jan-19
|
$ 170.50
|
-11.85%
|
|
28-Feb-19
|
$ 173.28
|
1.63%
|
|
31-Mar-19
|
$ 180.76
|
4.32%
|
| |
|
|
|
Average
|
$ 187.88
|
-0.36%
|
|
Standard Deviation
|
7.046%
|
|
Co-Efficient of Variation
|
1.44
|
Table 1: Calculation of Mean, Standard Deviation, Co-efficient of variation
References
ASX Top 50 Companies 2019, Viewed 18 April 2019, <https://www.asx50list.com/>.
CHO.AX Historical prices 2019, Viewed 18 April 2019, <https://au.finance.yahoo.com/quote/COH.AX/>.
Cochlear, Viewed 18 April 2019, <https://www.cochlear.com/us/en/about-us>.
Global Hearing Aids Market Forecast 2019-2027 2018, Viewed 18 April 2019, <https://www.reportlinker.com/p05586187/GLOBAL-HEARING-AIDS-MARKET-FORECAST.html>.
Hall, L 2019, Cochlear share price jumps higher on new implant announcement | Motley Fool Australia, Viewed 18 April 2019, <https://www.fool.com.au/2019/04/16/cochlear-share-price-jumps-higher-on-new-implant-announcement/>.
Investopedia 2018, How does beta reflect systematic risk, Viewed 18 April 2019, <https://www.investopedia.com/ask/answers/031715/how-does-beta-reflect-systematic-risk.asp>.
Investopedia Staff, Financial Concepts: The Risk/Return Tradeoff, Viewed 18 April 2019, <https://www.investopedia.com/university/concepts/concepts1.asp>.


