Task 1: Summary of Key Insights gained from the data set about the performance of the coffee chain company
1. Profit vs Sales of Each Market
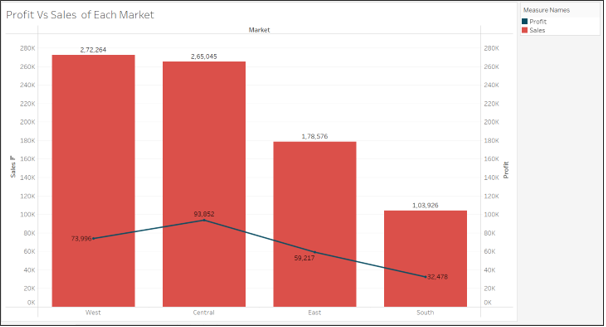
- As per Figure 1: Profit vs Sales of Each Market, we can see that on absolute terms, even though West Market has slightly higher sales than Central, but West market’s absolute profit is slightly lower than Central indicating lower operating costs for unit sales in Central Market.
2. Profit percentage of each market
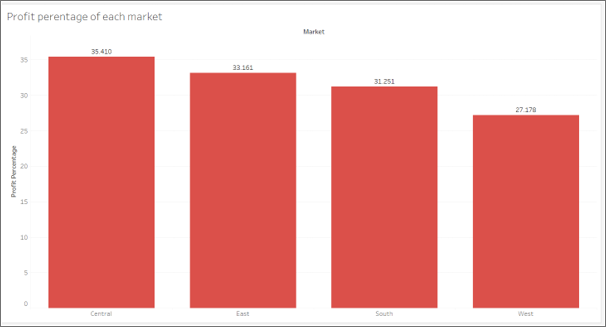
- As per Figure 2: Profit percentage of each market, we see that Central is the best performing market in terms of profit percentage and West is the worst.
3. State and Post Code Wise
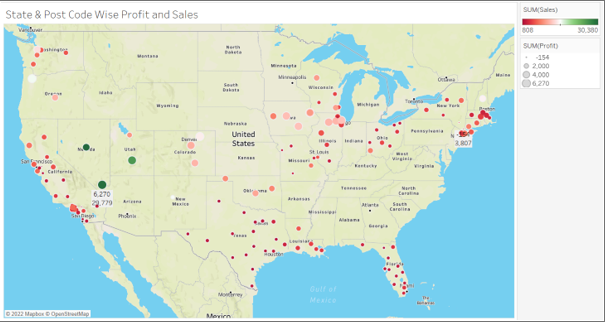
- Utah and Nevada are the 2 most sales-generating states. The lowest Sales producing state is Texas, Area Code – 903. The maximum Sales generating Area code is 775, i.e Nevada. (See Assignment 1B Learning activity 2 – Solution. twbx file)
- Maximum Profit-making Area code is 702, ie Las Vegas
The worst profit-making place is Area Code – 914 ie. in Westchester County, New York, i.e.,
4. Product Profit Vs Marketing Cost
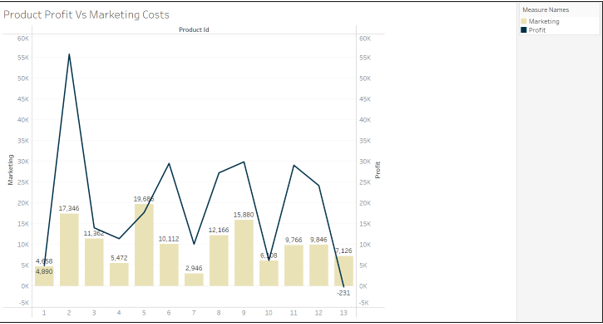
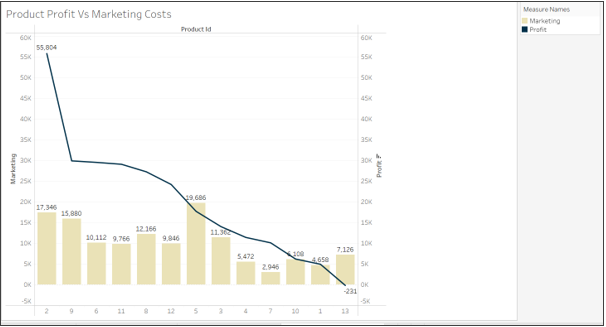
- Product Id 2 is the best performing product in terms of Marketing spending vs Profit generated.
- Worst product in terms of marketing spends vs profit generated was Product Id 13.
5. Sales Vs Marketing Cost
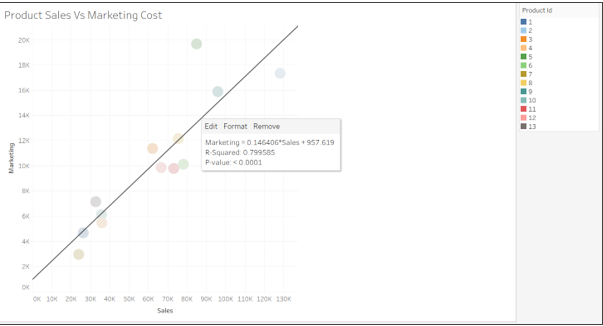
- Typically, from the graph as per Figure 6: Product Sales vs Marketing Cost, the product below the line is better. The Slope of the line represents the ratio of Marketing Cost/ Sales. The lower the slope the better. Hence, Product Ids lying below the line - 7,4,12,11,6,2 are better than other Products – Marketing investments were justified .
- Product Ids 1,10,8 are at the break-even point of cost/sales ratio. And are neutral rates in terms of the impact of marketing spends - Marketing investments were close to breakeven
- Product Ids 13,3,9,5 have made no significant positive impact on sales as compared to marketing spends -There was -ve ROI.
- Product Id 2 is the best performing and product Id 5 is the worst performing in terms of Marketing Cost vs Sales.
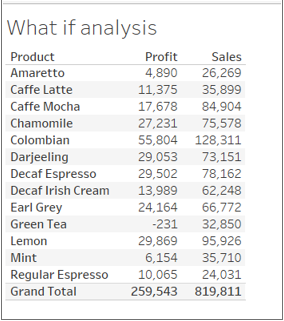
6. What -if Analysis
If any of the products are excluded (one at a time) – impact of profit can be seen as under
No exclusions in Products:
Expert's Answer
Chat with our Experts
Want to contact us directly? No Problem. We are always here for you


Get Online
Assignment Help Services


