- Services
- Academic Writing Service
- Assignment Help
- Academic Assignment Help
- Assignment Writers
- Custom Writing Services
- Online Assignment Help
- Effective Note-taking – Assignment Help
- Assignment Help Australia
- Write My Assignment
- Help on Assignments
- Buy Assignment Online
- Best Assignment Helper
- Assignment Paper Help
- College Assignment Help
- Help with Assignments Online
- Get Assignment Help
- Homework Assignment Help
- Thesis Writing Services
- Online Assignment Writer
- Collect material
- Assignment By Cities
- Assignments by Universities
- Essays
- Essay Writing Guide
- Essay Help
- Argumentative Essay
- Critical Essay
- Essay Writing Help on Comparison Essay
- College Essay
- Deductive Essay
- Essay Writer
- Admission Essay
- Online Essay Help
- Do My Essay Online
- Evaluative Essay
- History Essay Help
- Research Essay Help
- Urgent Essay Help
- Top Quality Essay
- Top Essay Writing Companies
- Cheap Essay Writing Help
- Professional Essay Help
- Cheap Essay Writer
- Essay Writers Online
- Need Help Writing Essay
- Essay Homework Help
- Write Essay Online
- Types of Essay
- Essay Writing Tips
- Essay Help Cities
- Other Services
- Dissertation Writing Assignment Help
- Cheap Assignment Help
- Creating An Appendix
- Assignment Help Tutors
- Assignment Assistance Australia
- Student Assignment Help
- Last Minute Assignment Help
- Urgent Assignment Help
- Assignment Provider
- Do My Assignment Help
- Make My Assignment For Me
- Solve My Assignment
- Custom Assignment Writing
- How to Write a Dissertation – Assignment Help
- Quality Assignment Help
- Write My Assignment For Me
- Assignment Writing Tips
- Buy Assignment
- Article Writing Service
- Assignment Help UK
- Animation Assignment Help
- Coursework Help
- College Assignment Help
- Leadership Assignment Help
- Network Planning Assignment Help
- Dissertation Proposal Writing Help
- Report Writing Help
- My Assignment Help
- Microsoft PowerPoint Presentation
- Pecha Kucha Presentation Help
- Pestel Analysis Assignment Help
- University Assignment Help
- Video Presentation Assignment Help
- Academic Writing Service
- Homework Help
- Subjects
- Sample Assignments
- Resources
- Blogs
- Get a Quote
Question 8:
The following diagram shows the cost curves of a firm under perfect competition.
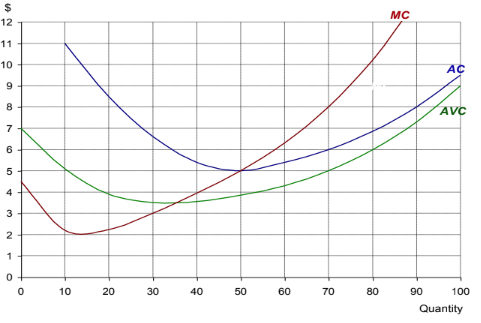
(a) How much will the firm produce in order to maximise profits at a price of $8 per unit? .......................(1/2 mark)
(b) What will be its average cost of production at this output?.............(1/2 marks)
(c) How much (supernormal) profit will it make? ........................................(2 marks)
(d) How much will the firm produce in order to maximise profits at a price of $5 per unit? ........................(1/2 mark)
(e) How much (supernormal) profit will it make? .............................(2 marks)
(f) How much will the firm produce in order to maximize profits at a price of $4 per unit? (1/2 mark)
(g) What will be its profit value be now? ................................................(2 marks)
(h) Below what price would the firm shut down in the short run? .............................(1 mark)
(i) Below what price would the firm shut down in the long run? ..............................(1 mark)
Expert's Answer

Chat with our Experts
Want to contact us directly? No Problem. We are always here for you

For Students in UK

For Students in USA

Our Globally Trusted Assignment Help Service Delivers Tailored Solutions with Expert Guidance, Timely Delivery, and Unmatched Quality for Students in the UK, Australia, and USA!