
Response Time
98%
31121
Tutor Profile
Subjects
Finance, Accounting, Management
EXCUETIVE SUMAMMARY
This report focuses on Nigeria’s alcohol market, as it is one of the biggest alcoholic drink producers in Africa, which has been analyzed according to the given substantives tests and APMC’s profitability. According to the market research, the alcoholic beverages industry in Nigeria is usually divided into three segments, i.e., based on product type, packaging style or size and channel of distribution. Therefore, the first section of the report focuses on the market demand and market segmentation. The market demand is analyzed according to the market share and profit of APMC, where it was assumed that the market share of APMC is 6%, while profit per ton is $30.
Market Analysis:
Furthermore, on the basis of market segmentation, the Nigerian market of alcohol industry is based on product, customer choices, behavior and distribution channel, which need to be linked to the Product and customer needs of APMC. Therefore, segmentation, in this report was particularly designed according to APMC players and profitability, where segmentation had two parts: product-based segmentation and customer-based segmentation (customer usage and customer channels). On analysis and substantive tests result, it was revealed that there are three main products, which need to targeted, namely, RTD, Cider/Perry and Spirits, while Beer and wine, do not have a substantive share in company’s profitability. In addition to this, customer segmentation is done on the basis of the B2B customers, i.e., for the product categories selected to be relevant for the business’s profitability.
Market Strategy:
The selling/marketing strategy of Nigeria is based on 4Ps model, i.e., product, distribution, personal selling and sales promotion and pricing, which is especially designed according to the analyzed target market segments, i.e., customer-based segments and product-based segments.
MARKET ANALYSIS
1. MARKET DEMAND
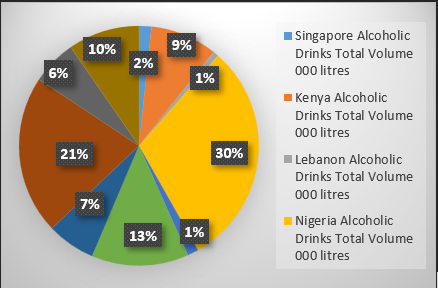
Table 1 shows ten main countries of alcohol drink, where Nigeria remains to be the market leader, among the lot, with an industry profit of $2,211,509.1 and APMC makes a profit of $3,980,716, in 2020, followed by Netherlands, Belgium, Kenya and Switzerland. The report will be focusing on Nigeria, as Nigeria is said to be the world's largest market for alcoholic beverages, with a market share of 30% (See figure 1). Though, according to the substantive test, shown in table 5, indicates that the total profit of Nigeria is $456,069, which does not makes it a substantive and relevant country for this market analysis, as its profit is less than the benchmark of $2000, 000. While other alcohol markets are also expanding rapidly, as Netherlands has a market share of 21%, Belgium 13%, Switzerland 10% and Kenya 9% (figure 1).
In terms of food and beverage imports, Nigeria is said to be one of the most dynamic and competitive markets of the world. Furthermore, due to increased consumer spending on alcohol and the growing establishment of restaurants, bars, and pubs, Nigeria's alcoholic beverage market is now likely to offer ideal investment opportunities for potential investors in the coming years, therefore, the market has shown tremendous success (6W Research, 2021). In recent years, the Nigerian market for alcohol drinks and cocktail beverages grew, significantly, as shown in figure 2, where 44% of beer was imported, followed by 4% of Spirits, and 1% of RTDs and Wine. Also, in 2020, the total alcohol litter production demand was of 2,211,509.10, where beer had a production demand of 1,958,137.60 litres, Cider/perry has a production demand of 47.3 L, RTD has a share of 30,441 litres, spirits 190,907.60, while demand for wine was 31,975.60 litres, as shown in figure 3 and table 2.
Nigeria is said to be one of the biggest alcoholic drinks producers in Africa and has been successful, since many years, due to many factors. While, comparing to nine other countries, Nigeria, proves to be the economic giant, producing the highest volume of alcoholic drinks, which is a total of over 20 million litres (table 2), in the year of 2020. On calculating for APMC profit, in 2020 and assuming it will gain a $30 profit, from using ‘tons” of different products, China will have a 6% of the market share (given data assumption), and eventually it ends up with a APMC profit of, $3,980,716, (See table 1), where total production in litres in 2020 was 1,958,137,600 (see table 2).
Table 1: Selected 10 countries data
|
Geography |
Category |
Data Type |
Unit |
2020 |
APMC Profit |
|
Singapore |
Alcoholic Drinks |
Total Volume |
000 liters |
122,589.5 |
$ 220,661 |
|
Kenya |
Alcoholic Drinks |
Total Volume |
000 liters |
659,312.4 |
$ 1,186,762 |
|
Lebanon |
Alcoholic Drinks |
Total Volume |
000 liters |
55,593.8 |
$ 100,069 |
|
Nigeria |
Alcoholic Drinks |
Total Volume |
000 liters |
2,211,509.1 |
$ 3,980,716 |
|
United Arab Emirates |
Alcoholic Drinks |
Total Volume |
000 liters |
109,035.8 |
$ 196,264 |
|
Belgium |
Alcoholic Drinks |
Total Volume |
000 liters |
955,007.1 |
$ 1,719,013 |
|
Ireland |
Alcoholic Drinks |
Total Volume |
000 liters |
476,127.2 |
$ 857,029 |
|
Netherlands |
Alcoholic Drinks |
Total Volume |
000 liters |
1,561,281.9 |
$ 2,810,307 |
|
Norway |
Alcoholic Drinks |
Total Volume |
000 liters |
440,190.1 |
$ 792,342 |
|
Switzerland |
Alcoholic Drinks |
Total Volume |
000 liters |
702,647.9 |
$ 1,264,766 |
(Source: Passport, 2021)
Table 2: Nigeria Product Segmentation
|
Geography |
Category |
Data Type |
Unit |
Year 2020 |
2020 Data in Liters |
2020 Data in Tones |
|
Nigeria |
Alcoholic Drinks |
Total Volume |
000 liters |
2211509.1 |
2211509.1 |
2211.509 |
|
Nigeria |
Beer |
Total Volume |
000 liters |
1958137.6 |
1958137600 |
1958137.6 |
|
Nigeria |
Cider/Perry |
Total Volume |
000 liters |
47.3 |
47300 |
47.3 |
|
Nigeria |
RTDs |
Total Volume |
000 liters |
30441 |
30441000 |
30441 |
|
Nigeria |
Spirits |
Total Volume |
000 liters |
190907.6 |
190907600 |
190907.6 |
|
Nigeria |
Wine |
Total Volume |
000 liters |
31975.6 |
31975600 |
31975.6 |
Figure 1: Total Market share in 2020
(Source: Passport, 2021)
Figure 2: Nigerian Import in 2020
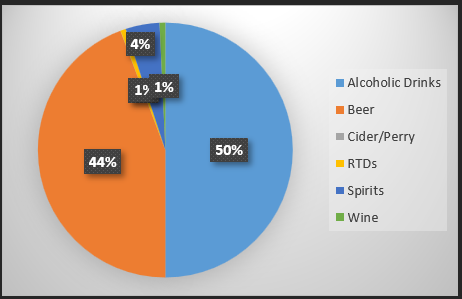
Figure 3: Total litres in 2020
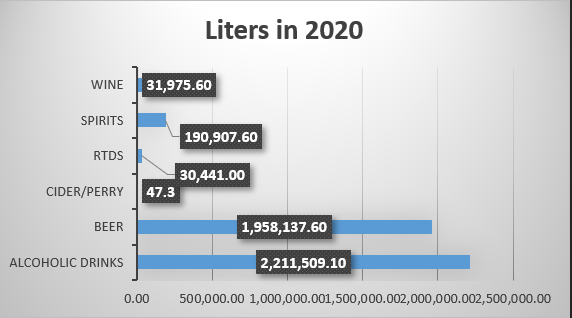
The total alcohol demand was more than 22 million liters, in 2020, while the market is divided in different products like Beer, holding the largest volume of 1,958,137,600 liters, i.e., 44% market share (table 2 and figure 2), followed by Sprit, with a demand of 1, 90,907,600 liters, having a 4% share, while Wine has a demand of 31975 litres share, followed by RTD and Cider/perry (See table 2 and Figure 3). In terms of product and sub-category demand in Nigeria, the data has been collected and analysed over a 10-year period, i.e., from 2015 to 2025, where beer remains to be the highest demanded product, in the alcoholic category, with a constant increase trend in the decade’s period, as shown in Figure 4. Also, beer production is consistently growing from, 1737926 liters in 2015 to 2369027, in 2025, as shown in Table 3. But it is estimated that there will be a slight drop in demand, from 2020 to 2025, due to the global pandemic and other economic reasons. Furthermore, Spirits are the second most highly demanded item, which has rolled out to increase from the period of 2015 to 2020, where the demand was 168252.8 liters, in 2015, while it increased to 190, 907 liters, in 2020 (Table 3), and further expected to grow from 2021 to 2025 (Table 3). Next, the demand of Wine also experienced an upward tilt, where in 2015, the demand was 26740.1 liters, which is forecasted to increase till 2025, i.e., till 38990 liters (table 3).
On the other hand, cider/perry and RTDs are considered not being very popular item in the alcohol market, of the country. According to table 3, there is decline in demand of both the products/items. For RTDs, the demand was 82743.8 litres, in 2015, which decreased dramatically in 2016, to 30491 litres. From 2017to 2019, the demand increased gradually, but in 2020, the total demand dropped to 30441 litres, may be due to Covid 19, and then is forecasted to have a negative trend till 2025. Similarly, the demand for cider was 64.5 litres, in 2015, which decreased to 47.3, in 2020, but is predicted to increase in future (See Table 3).
Figure 4: Product type in Nigerian Market
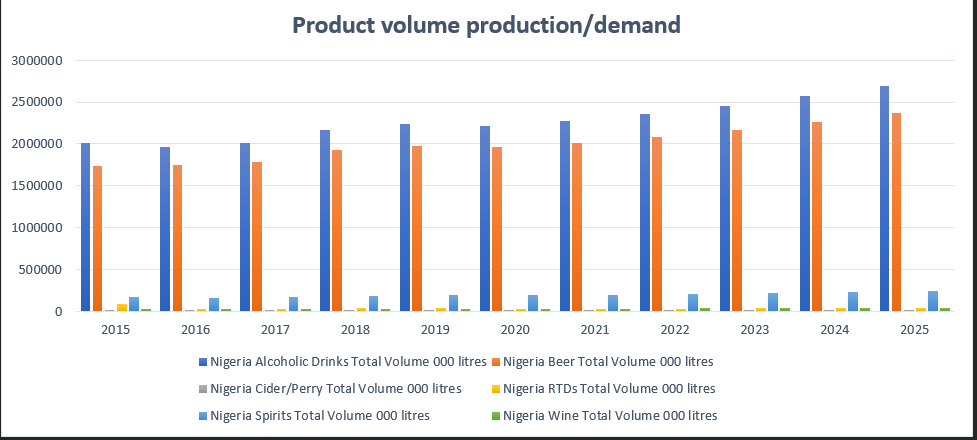
Table 3: Production of Alcoholic Drinks by Product Type 2016-2025
|
Geography |
Category |
Data Type |
Unit |
2015 |
2016 |
2017 |
2018 |
2019 |
2020 |
2021 |
2022 |
2023 |
2024 |
2025 |
|
Nigeria |
Alcoholic Drinks |
Total Volume |
000 liters |
2015727 |
1963503 |
2013578 |
2171160 |
2237183 |
2211509 |
2273523 |
2353885 |
2451551 |
2568287 |
2685920 |
|
Nigeria |
Beer |
Total Volume |
000 litters |
1737926 |
1745931 |
1785740 |
1930122 |
1977832 |
1958138 |
2011042 |
2080410 |
2165180 |
2266993 |
2369027 |
|
Nigeria |
Cider/Perry |
Total Volume |
000 liters’ |
64.5 |
51.6 |
52 |
46.7 |
49.1 |
47.3 |
47.9 |
49 |
50.4 |
52 |
53.5 |
|
Nigeria |
RTDs |
Total Volume |
000 liters’ |
82743.8 |
30491.1 |
32583.4 |
33782.8 |
34841.8 |
30441 |
31373.6 |
32492.4 |
33749.6 |
35174.1 |
36769.9 |
|
Nigeria |
Spirits |
Total Volume |
000 liters’ |
168252.8 |
161150.8 |
168693 |
177626.5 |
192034.4 |
190907.6 |
198078.9 |
206806.3 |
217074.2 |
228939.2 |
241080.2 |
|
Nigeria |
Wine |
Total Volume |
000 liters |
26740.1 |
25878.6 |
26509.2 |
29581.4 |
32426 |
31975.6 |
32979.7 |
34127.7 |
35497 |
37127.8 |
38989.7 |
(Source: Passport, 2021)
Table 4: Substantive Test (product category)
|
Table 1 - Substantive Segment Test Calculation (Product Category). |
||||||
|
Nigeria |
Tones in segment - 2020 Data |
APMC 'Profit' per tons ($) |
APMC market Share (Percent) |
APMC profit ($) |
Does Segment Pass Substantive Test? |
Substantive segment test amount ($) |
|
Segment name |
$ 91,213.74 |
|||||
|
Beer |
47.3 |
$20 |
10% |
$ 94.60 |
NO |
|
|
Cider/Perry |
30,441.0 |
$20 |
10% |
$ 60,882.00 |
NO |
|
|
RTDs |
190,907.6 |
$20 |
10% |
$ 381,815.20 |
YES |
|
|
Spirits |
31,975.6 |
$20 |
10% |
$ 63,951.20 |
NO |
|
|
Wine |
0.0 |
$20 |
10% |
$ - |
NO |
|
|
Total Alcoholic Drinks Industry |
253,371.5 |
|
|
$ 506,743.00 |
|
|
Table 5: Substantive Test (Country)
|
Substantive Test Calculation (Country) |
||
|
DOES THE COUNTRY I SELECTED MEET THE OVERALL SUBSTANTIVE TEST? IE AN APMC PROFIT > $2,000,000 BASED ON THE INITIAL ASSUMPTIONS? |
||
|
COUNTRY |
PROFIT |
MEETS TEST |
|
Nigeria |
$ 456,068.70 |
NO |
1. MARKET SEGMENTATION
General overview and Industry Analysis
Due to intense competition in every sector, major companies and brands, need to improve their marketing systems and business structures, continuously, according to the market needs. In order to grow the market share in alcohol markets, alcoholic companies and brands need to target the correct customer and promote their product to the proper audience, in order to remain competitive (Dietrich et al., 2016:3), for which segmentation is required. Market segmentation is the most relevant technique, used for segmenting or segregating the customers into homogeneous groups, on the basis of their common needs and product demands. (Dolnicar, Grün and Leisch, 2018:2).
According to the market research, Nigeria is the second-largest user of alcoholic beverages in Africa, according to the report of World Bank. Also, Nigeria is said to be one of the fastest-growing alcoholic beverage markets in Africa, which is due to the country's rapid urbanization, growing populations and improved standard of living and spending power of customers (6W Research, 2021). According to (Statista, 2021) the Alcoholic Drinks market of Nigeria is forecasted to generate US$33,552 million revenue, in 2021. The market is predicted to expand by CAGR of 13.34% every year. Where, Cider, Perry, and Rice Wine is the market's largest sectors or segments, with an expected market volume of US$27,846 million.
Additionally, alcohol market segmentation usually emphases on a number of features, that include product characteristics, occasion of use, demographical profiles of the customers, customer preferences and customer spending power (Liu et al., 2014:3). The alcohol market is typically divided into three main categories, which are based on product type, packaging style and the distribution channels. Similarly, alcohol market is segmented on the basis of customer preferences, whether in terms of popularity, promotional methods and channel of advertising.
Hence, on the basis of above discussion, the segmentation for the alcohol industry will be done on the basis of product categories, customer behaviour and channel of distribution, which need to be taken into account by all the market players of the Nigerian alcohol market.
Segmentation in This Case:
According to, (6W Research, 2021), the Nigerian alcohol market is segmented on the basis of product type, packaging and distribution channel. This report will take into account the segmentation of alcohol market of Nigeria, as it is a substantive country, giving a profit of $3,980,716.38 (table 4). In this situation, segmentation is done on the basis of two things, i.e., the product-based segmenting (product type) and customer-based segmentation (customer usage). According to Table 6, the total tonnes produced by Nigerian alcohol industry for 2020 were 253371.5 tons, where every product in APMC profit, accounted for a market share of 6%, with a total profit of $456,068.7, while the substantive level was calculated to be $3,980,716. In table 7, the APMC profit is $506743, where the market share of all products is 10%, while table 8 shows APMC profit to be same as in table 7, though, beer and wine have a market share of 6%, while other 3 products have a share of 10%. Now, segmentation will be done, in light of product categories:
Product Based Segmentation
Product based segmentation is one of the major ways to distribute the alcohol market. According to Table 1 above, it can be viewed that the overall usage/demand of Alcohol drinks is of 2,211,509 litres, which earned a profit of $ 3,980,716, in 2020. The market is further divided, on the basis of tons of the key drinks, specifically: beer, which is the major contributor, with production of 1958138 tons, followed by Spirits with a production of 190908 tons, followed by Wine, with 31976, and RTD producing 30441 tons (Table 2).
Moving on to the substantive tests for product segmentation, where, Table 6 shows that none of the item in the product category passed the substantive test, where market share of each product in APMC profit is of 6%. While, Table 7 shows that product category of RTD, Cider/Perry and Spirits are substantial, when the market share is 10%. Lastly, Table 8 shows that Beer and Wine are not substantial profit contributors, while Cider, sprits and RTD are substantive products in nature, when APMC market share differs (table 6 to 8) therefore, the report considers spirits, RTD and cider/Perry to be the contributing product segments in the APMC profit, while other two are also considered in product segments of the overall Alcohol market. Moreover, the key products of Nigerian Market are beer, spirits and Wine (6W Research, 2021), whereas, in this case, beer and wine, fail the substantive test, according to data analysis, whereas, other three product categories have substantial share in the APMC profit, therefore, these three product categories will be focused more in this report.
According to table 9, i.e., the ‘what if scenario’, where the profit sharing for each product, has been forecasted from 2021 to 2025, on the basic assumptions, where profit per ton of each product is $20, while the market share is 10%. Where the total market share of APMC is 6%, and profit per ton is $30. The total alcohol market profit for APMC is then calculated to be $4,026,929.22, for the year of 2020 (base year) and is predicted to grow each year, reaching to $4,622,916, by 2025. Beer is the market leader, and again holds the largest share in APMC profit, i.e., of $3,955,663, followed by Wine, which accounted for a profit of $384,069, whereas the profits recorded for RTDS $69,683.60, Wine $64,852.00 and cider $98.20, in 2020 (See table 9).
Table 6: Substantive Segment Test 1: (Product Category)
|
Nigeria |
Tones in segment - 2020 Data |
APMC 'Profit' per tons ($) |
APMC market Share (Percent) |
APMC profit ($) |
Does Segment Pass Substantive Test? |
Substantive segment test amount ($) |
|
Segment name |
$ 3,806,946.72 |
|||||
|
Beer |
47.3 |
$30 |
6% |
$ 85.14 |
NO |
|
|
Cider/Perry |
30,441.0 |
$30 |
6% |
$ 54,793.80 |
NO |
|
|
RTDs |
190,907.6 |
$30 |
6% |
$ 343,633.68 |
NO |
|
|
Spirits |
31,975.6 |
$30 |
6% |
$ 57,556.08 |
NO |
|
|
Wine |
0.0 |
$30 |
6% |
$ - |
NO |
|
|
Total Alcoholic Drinks Industry |
253,371.5 |
|
|
$ 456,068.70 |
|
(Source: Passport, 2021)
Table 7: Substantive Segment Test 2: (Product Category)
|
Australia |
Tones in segment - 2020 Data |
APMC 'Profit' per tons ($) |
APMC market Share (Percent) |
APMC profit ($) |
Does Segment Pass Substantive Test? |
Substantive segment test amount ($) |
|
Segment name |
$ 3,806,946.72 |
|||||
|
Beer |
47.3 |
$30 |
6% |
$ 94.60 |
NO |
|
|
Cider/Perry |
30,441.0 |
$70 |
10% |
$ 60,882.00 |
YES |
|
|
RTDs |
190,907.6 |
$20 |
10% |
$ 381,815.20 |
YES |
|
|
Spirits |
31,975.6 |
$65 |
10% |
$ 63,951.20 |
YES |
|
|
Wine |
0.0 |
$30 |
6% |
$ - |
NO |
|
|
Total Alcoholic Drinks Industry |
253,371.5 |
|
|
$ 506,743.00 |
|
(Source: Passport, 2021)
Table 8: Substantive Segment Test 3: (Product Category)
|
Australia |
Tones in segment - 2020 Data |
APMC 'Profit' per tons ($) |
APMC market Share (Percent) |
APMC profit ($) |
Does Segment Pass Substantive Test? |
Substantive segment test amount ($) |
|
Segment name |
$ 3,806,946.72 |
|||||
|
Beer |
47.3 |
$30 |
6% |
$ 94.60 |
NO |
|
|
Cider/Perry |
30,441.0 |
$66 |
10% |
$ 60,882.00 |
YES |
|
|
RTDs |
190,907.6 |
$15 |
10% |
$ 381,815.20 |
YES |
|
|
Spirits |
31,975.6 |
$64 |
10% |
$ 63,951.20 |
YES |
|
|
Wine |
0.0 |
$30 |
6% |
$ - |
NO |
|
|
Total Alcoholic Drinks Industry |
253,371.5 |
|
|
$ 506,743.00 |
|
(Source: Passport, 2021)
Table 9: Projected Profit Calculation using “What if” scenarios
|
Table 3 - Project Profit Calculation using various What if scenarios for different Profit/Market Share Combinations. |
ASSUMPTIONS |
||||||||
|
PROJECTED PROFIT CALCULATION |
2020 |
2021 |
2022 |
2023 |
2024 |
2025 |
PROFIT |
MARKET |
|
|
Projected Profit |
Projected Profit |
Projected Profit |
Projected Profit |
Projected Profit |
Projected Profit |
PER TONNE |
SHARE |
||
|
Country |
Segment Name |
Base Year |
Year |
Year |
Year |
Year |
Year |
$ |
% |
|
Nigeria |
Alcoholic Drinks |
$ 4,026,929.22 |
$ 3,980,716.38 |
$ 4,092,340.68 |
$ 4,236,993.36 |
$ 4,412,791.26 |
$ 4,622,915.70 |
30 |
6% |
|
Nigeria |
Beer |
$ 3,955,663.20 |
$ 3,916,275.20 |
$ 4,022,084.80 |
$ 4,160,819.60 |
$ 4,330,359.00 |
$ 4,533,986.80 |
20 |
10% |
|
Nigeria |
Cider/Perry |
$ 98.20 |
$ 94.60 |
$ 95.80 |
$ 98.00 |
$ 100.80 |
$ 104.00 |
20 |
10% |
|
Nigeria |
RTDs |
$ 69,683.60 |
$ 60,882.00 |
$ 62,747.20 |
$ 64,984.80 |
$ 67,499.20 |
$ 70,348.20 |
20 |
10% |
|
Nigeria |
Spirits |
$ 384,068.80 |
$ 381,815.20 |
$ 396,157.80 |
$ 413,612.60 |
$ 434,148.40 |
$ 457,878.40 |
20 |
10% |
|
Nigeria |
Wine |
$ 64,852.00 |
$ 63,951.20 |
$ 65,959.40 |
$ 68,255.40 |
$ 70,994.00 |
$ 74,255.60 |
20 |
10% |
Customer based segmentation
Customer based segmentation is divided into two parts, i.e., the customer behaviour or usage and the channel function, as shown in table 10 and 11, below. According to table 12, 13 and 14 there are 40 customers’ profiles, for all three product categories, which are contributing in the profit of APMC, where spirits companies are the most in the market, to be precise, there are 28 customer profiles, while small companies are added up in the others account row, as shown in table 14. While, RTD product category has 6 customer profiles, while small customers, are added up in the others account, shown in table 13. Lastly, Cider/Perry has only 2 main customers, while all other small customers are added up in the others section, as shown in Table 12.
When it comes to packaging, the alcohols in Nigerian Alcohol industry are segmented on the basis of cans, glass bottles and plastic bottles. While, on the basis of distribution channels, the segmentation is done on the basis of hypermarkets, supermarkets, restaurants, bars, specialty stores and online retail shops (6W Research, 2021). While in this case, segmentation is done on the basis of customer behaviour, customers are divided into 3 categories, low usage customers, medium usage customers and high usage customers, which will be our target (Table 10), where high usage customer buy big quantities, medium usage customers buy medium or reasonable quantity, while low usage customers, buy a lesser quantity. While, when segmented on the basis of channel distribution, high usage customers need more information, medium usage customers need reasonable amount of information and low usage customers need no or very basic information (Table 11).
Segmenting Customer on the basis of usage/customer behaviour
According to table 10, the companies (B2B customers) are divided into three categories, i.e. high usage, medium usage and low usage, on the basis of the customer behaviour. Where High usage customers, buy larger containers, bulk quantities of bottles, packaging and caps etc. and buy multiple designs, colours, brands etc. Whereas, the medium usage customers buy different sizes, designing and packs for same or few brands and they do not order containers, but a reasonable quantity. Lastly, the low usage customers need a very less quantity of the products.
Segmentation on the basis of channel function
Table 11, shows that channel function is a segment where users are divided in to 3 main categories, i.e., the high usage, medium usage and low usage customers, where customers are B2B customers, who need product information, product modification, lot size information, logistics and after sales services, etc. The high usage customers require a lot of information, substantive automated functions, specialized orders, value adding after sales services, etc. Though, medium usage customers need relevant and sufficient information, delivery services, maintenance services and catalogue products etc. Lastly, the low usage customers are small companies or vendors, who need no or less information, their lot sizes are a lot small and need the delivery service.
Segmenting Customer on the basis of Product category
According to the results of substantive tests, the main product segmentation for this report is according to RTD, Ciders and Spirits. Table 12 shows that the main two B2B customers of the Cider/Perry product category are Distell Group Ltd. and Heineken NV, while all other small companies are grouped up, in the other’s row. Figure 5 show that Distell Group Ltd. is the highest contributing customer, in the profit of APMC, as it has bought highest level of litres from the company.
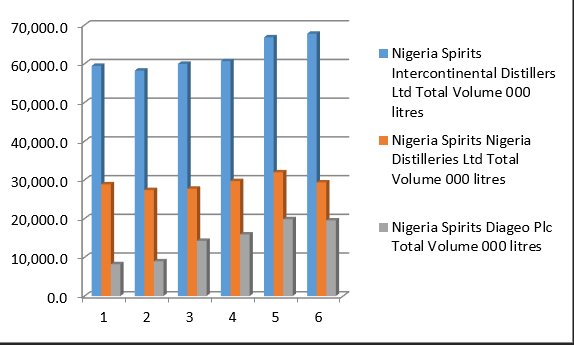
Table 13 present the customers/companies buying RTDs and have a contribution in APMC profit, where Diageo Plc, proves to be the largest customer, in this product category, where in 2015, it had a consumption/demand of 74,703 litres, which fell to the range to 22,577 in 2020, but still remains to be the largest (high usage) customer in this category. Second, comes Heineken NV, who seems to be a low usage customer, as it buys only 3256 litres in 2020, which is below 5000 litres (assumption: customers buying below 5000L are considered to be low usage customers). Figure 6 also indicates that only Diageo Plc is the high usage customer.
Furthermore, Table 14 presents the customer companies, for Spirits, where three main customers have been identified, namely, Intercontinental Distillers Ltd., Nigeria Distilleries Ltd. and Diageo Plc., who order and buy more than 15000 litres. Also, there are 28 customers, in this segment, and other small companies, who also hold a substantive share in APMC’s profitability. Figure 7 also shows that Intercontinental Distillers Ltd. is the high usage customer, and order more than 60000 litres, each year, followed by Nigeria Distilleries Ltd., who is medium usage company, and orders less than 50000 litres, while more than 25000 litres, each year. Diageo Plc. Is low usage customer, who gives a business of more than 15000 litres, each year (table 14).
Table 10: Customer behaviour Segmentation
|
Customer behaviour |
Target 1 High-usage customers |
Target 2 Medium-usage customers |
Target 3 Low-usage customers |
|
What customers buy |
Buys film containers, bottles, wrapping film, bottle cap, plastic stickers, label.
Buys different colours, designs, logos, brands, shapes, sizes, materials. |
Buy bottles, wrapping films, bottle cap, label.
Buy different designs, shapes, sizes. |
Buy bottles, wrapping films, bottle caps.
Buy different designs, shapes, sizes. |
|
How customers buy |
Buy large quantities of each item; Having formal buying process; Buy centrally for multiple locations; Required delivery and storing services. |
Buy moderate quantities of each item; Having formal buying process; Buy centrally for multiple locations |
Buy small quantities of specific item or each item; Having formal buying process. Having their own deliverers. |
|
How customers use their purchase |
Customers have automated bottling and filming machines; Customers wrap their products in blister packs; Customers wrap pallets, Customers wrap other ingredients throughout the process. |
Customers have automated bottling; Customers wrap their products in blister packs; Customers wrap pallets, Customers wrap other ingredients throughout the process. |
Customers have automated bottling; Customers wrap their products in blister packs; Customers wrap pallets, Customers wrap other ingredients throughout the process. |
Table 11: Channel function Segmentation
|
Channel Function |
High-usage customers |
Medium-usage customers |
Low-usage customers
|
|
Product Information |
Needs high level of detailed information. |
Needs no information. |
Needs no information. |
|
Product Customization |
Needs custom-made product. |
Needs catalogue products. |
Needs catalogue products. |
|
Product Quality Assurance |
Needs ‘high’ quality assurance. |
Quality assurance is needed. |
Quality assurance is needed. |
|
Lot Size |
Needs large amount of delivery at one time. |
Needs small amount of delivery at one time. |
Needs small amount of delivery at one time. |
|
Assortment |
Needs to order a wide range of products. |
Needs to order a small range of products. |
Needs to order a small range of products. |
|
Availability |
Needs high level of product availability. |
Needs high level of product availability. |
Needs low level of product availability. |
|
After-sales services |
Needs high level of service and maintenance. |
Needs low level of service and maintenance. |
Needs low level of service and maintenance. |
|
Logistics |
Needs high quality of delivery and storage services. |
Needs delivery services. |
Needs no delivery services. |
Table 12: Customer Segment- Cider Companies
|
Geography |
Category |
Company Name |
Data Type |
2015 |
2016 |
2017 |
2018 |
2019 |
2020 |
|
Nigeria |
Cider/Perry |
Distell Group Ltd |
Total Volume |
47.8 |
33.7 |
34.0 |
30.5 |
33.0 |
33.3 |
|
Nigeria |
Cider/Perry |
Heineken NV |
Total Volume |
13.2 |
13.3 |
14.0 |
12.1 |
12.3 |
11.0 |
|
Nigeria |
Cider/Perry |
Others |
Total Volume |
3.6 |
4.5 |
4.0 |
4.0 |
3.8 |
3.0 |
|
Nigeria |
Cider/Perry |
Total |
Total Volume |
64.5 |
51.6 |
52.0 |
46.7 |
49.1 |
47.3 |
(Source: Passport)
Table 13: Customer segment-RTD Companies
|
Geography |
Category |
Company Name |
Data Type |
2015 |
2016 |
2017 |
2018 |
2019 |
2020 |
|
Nigeria |
RTDs |
Diageo Plc |
Total Volume |
74,703.0 |
21,955.9 |
26,616.0 |
25,298.1 |
25,773.8 |
22,576.6 |
|
Nigeria |
RTDs |
Heineken NV |
Total Volume |
2,385.0 |
1,546.3 |
3,037.2 |
3,035.9 |
3,226.5 |
3,256.1 |
|
Nigeria |
RTDs |
Intercontinental Distillers Ltd |
Total Volume |
3,134.9 |
156.7 |
- |
- |
600.0 |
610.0 |
|
Nigeria |
RTDs |
Kiss Mix Drinks Co, The |
Total Volume |
706.9 |
365.9 |
445.8 |
432.9 |
448.1 |
440.0 |
|
Nigeria |
RTDs |
Hale wood International Ltd |
Total Volume |
940.1 |
295.7 |
208.0 |
216.5 |
223.0 |
220.0 |
|
Nigeria |
RTDs |
J Garcia Carrion SA |
Total Volume |
277.0 |
187.6 |
192.7 |
199.7 |
209.3 |
193.0 |
|
Nigeria |
RTDs |
Others |
Total Volume |
597.0 |
5,983.0 |
2,083.7 |
4,599.7 |
4,361.1 |
3,145.3 |
|
Nigeria |
RTDs |
Total |
Total Volume |
82,743.8 |
30,491.1 |
32,583.4 |
33,782.8 |
34,841.8 |
30,441.0 |
(Source: Passport)
Table 14: Customer Segment- Spirit Companies
|
Geography |
Category |
Company Name |
2015 |
2016 |
2017 |
2018 |
2019 |
2020 |
|
Nigeria |
Spirits |
Intercontinental Distillers Ltd |
59,464.4 |
58,246.3 |
59,964.2 |
60,673.2 |
66,821.8 |
67,754.0 |
|
Nigeria |
Spirits |
Nigeria Distilleries Ltd |
28,862.8 |
27,377.9 |
27,736.9 |
29,705.0 |
31,966.4 |
29,355.0 |
|
Nigeria |
Spirits |
Diageo Plc |
8,230.6 |
8,979.3 |
14,274.9 |
15,902.8 |
19,836.3 |
19,525.2 |
|
Nigeria |
Spirits |
Best Global Brands Ltd |
4,719.3 |
7,469.9 |
8,237.1 |
8,569.6 |
9,726.7 |
9,868.2 |
|
Nigeria |
Spirits |
Stellar Beverages Ltd |
- |
184.4 |
1,684.0 |
6,149.5 |
6,839.9 |
6,912.0 |
|
Nigeria |
Spirits |
Kasapreko Co Ltd |
9,091.8 |
8,072.9 |
6,500.0 |
6,031.0 |
6,184.4 |
5,500.0 |
|
Nigeria |
Spirits |
Monument Distillers Nigeria Ltd |
- |
- |
- |
- |
3,534.0 |
3,700.0 |
|
Nigeria |
Spirits |
Tobal Import Drinks SL |
3,753.5 |
3,180.9 |
3,260.7 |
3,380.3 |
3,718.1 |
3,500.0 |
|
Nigeria |
Spirits |
Mohan Meakin Ltd |
1,332.3 |
1,488.4 |
2,172.1 |
2,800.0 |
3,375.9 |
3,300.0 |
|
Nigeria |
Spirits |
Pernod Ricard Groupe |
653.7 |
1,091.5 |
1,230.1 |
1,471.3 |
2,203.6 |
2,295.8 |
|
Nigeria |
Spirits |
Kerlin Products Ltd |
2,749.1 |
2,634.4 |
2,681.6 |
2,206.3 |
2,346.3 |
2,260.0 |
|
Nigeria |
Spirits |
Rémy Cointreau Group |
737.5 |
508.9 |
495.2 |
550.9 |
573.1 |
560.5 |
|
Nigeria |
Spirits |
LVMH Moët Hennessy Louis Vuitton SA |
782.8 |
440.7 |
466.5 |
502.0 |
546.0 |
532.5 |
|
Nigeria |
Spirits |
William Grant & Sons Ltd |
395.0 |
325.4 |
339.0 |
377.9 |
423.6 |
413.4 |
|
Nigeria |
Spirits |
Bacardi & Co Ltd |
1,231.2 |
1,009.5 |
914.6 |
774.5 |
446.1 |
411.6 |
|
Nigeria |
Spirits |
Olof Bergh Solera Brandy Cellar |
430.4 |
301.6 |
306.4 |
340.0 |
367.2 |
355.0 |
|
Nigeria |
Spirits |
Brown-Forman Corp |
403.2 |
271.8 |
274.5 |
287.4 |
312.0 |
310.0 |
|
Nigeria |
Spirits |
E&J Gallo Winery Inc |
442.3 |
315.5 |
318.9 |
319.7 |
319.3 |
307.0 |
|
Nigeria |
Spirits |
Campari Milano SpA, Davide |
237.5 |
176.3 |
175.7 |
206.3 |
210.3 |
198.9 |
|
Nigeria |
Spirits |
Pérez Barquero SA |
420.4 |
256.3 |
233.9 |
200.0 |
177.3 |
148.0 |
|
Nigeria |
Spirits |
Monsieur Pascal Wine |
154.1 |
107.4 |
107.6 |
120.0 |
132.9 |
130.0 |
|
Nigeria |
Spirits |
Lamb & Watt Ltd |
182.2 |
120.7 |
109.9 |
117.0 |
121.5 |
120.0 |
|
Nigeria |
Spirits |
Southwest Distillers |
127.5 |
96.7 |
98.8 |
99.1 |
98.5 |
94.0 |
|
Nigeria |
Spirits |
Distell Group Ltd |
248.1 |
202.0 |
230.2 |
260.2 |
293.5 |
87.4 |
|
Nigeria |
Spirits |
Anheuser-Busch InBev NV |
- |
2,197.1 |
3,562.9 |
3,373.3 |
- |
- |
|
Nigeria |
Spirits |
Beam Inc |
- |
- |
- |
- |
- |
- |
|
Nigeria |
Spirits |
SABMiller Ltd |
574.2 |
- |
- |
- |
- |
- |
|
Nigeria |
Spirits |
UB Group |
- |
- |
- |
- |
- |
- |
|
Nigeria |
Spirits |
Others |
43,028.7 |
36,095.1 |
33,317.5 |
33,209.2 |
31,459.8 |
33,269.2 |
|
Nigeria |
Spirits |
Total |
168,252.8 |
161,150.8 |
168,693.0 |
177,626.5 |
192,034.4 |
190,907.6 |
Figure 5: Cider Customer share on basis of volume
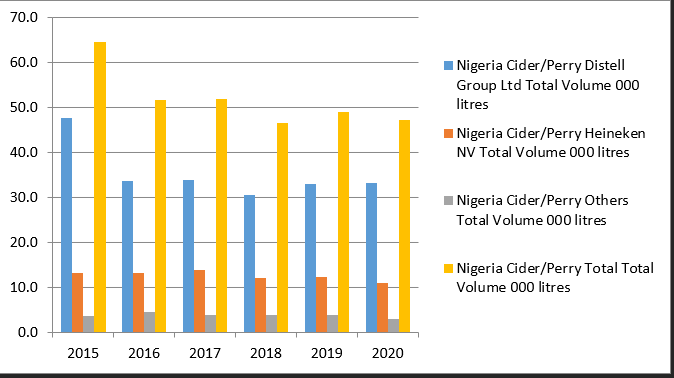
Figure 6: RTD Customer companies share on basis of volume
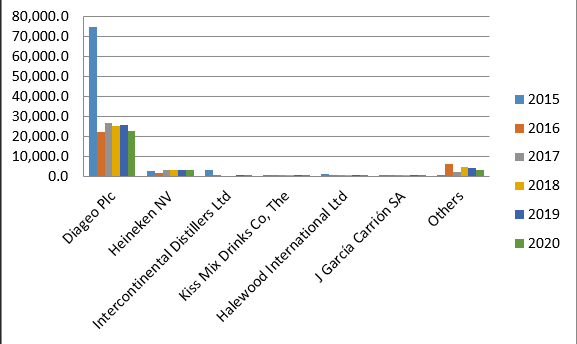
Figure 7: Spirits Customer companies
TARGET MARKET STRATEGY
ANALYSIS SUMMARY
A marketing strategy is said to be the collection of diversified, unique and appealing marketing techniques, which are designed, in order to promote financial growth and ensure the long-term financial health of the business (Faria and Ferreira, 2021). Any industry's effectiveness and success is determined by its key players' market strategies; consequently, it is important to have a solid business model and strong marketing strategy, in order to be profitable and relevant for the customers (Nadeem, 2018). Furthermore, a marketing plan should be established while taking into account the needs of the industry, the global industry, and the needs of local market customers (Ochieng, 2014:3).
There has been a significant shift in the overall marketing strategy, in various industries, with marketing tactics, mainly focusing on the customer's need, like in this case. The African Alcohol market has been labeled to be "diamond," when it comes to the alcohol business, where key countries in African industry are Kenya, Nigeria, South Africa, and Uganda (Obot, 2013:66). In this Report, focuses is on Nigeria. Therefore, many Nigerian companies have huge interest in this market and they are investing, significant investment amounts into this market and using multiple tools to promote different kinds of alcohol beverages. Furthermore, Alcohol companies are among the biggest advertisers in the country. Large Players, such as Heineken, Diageo, and SABMiller are investing heavily in new products and advertising their brands in an effective manner (Obot, 2013:66).
In addition to this, in this marketing plan report, the strategy needs to be designed, according to the market segmentation of the whole alcohol industry of Nigeria, as well on the basis of 2 targets or segments, formulated in the above section (market segmentation). For designing a strategy, there is a need to focus on long-term goals of the company, i.e., the profitability of APMC, in this report and also the four marketing mix, i.e., Product, Distribution, pricing and promotion, via personal selling.
Selling Alcohol products, with Marketing Mix:
When it comes to selling or marketing products, especially the alcohol beverages or related alcohol products, the marketing strategy caters the process of selling the products to the right customers and deliver products and the right information to potential customers, by promotion, advertising or using other media tools, etc (Mziba and Tlapana, 2020:2).
When businesses employ marketing mix to develop their business strategy, it means that the approach is customer centric. Where, firm uses a combination of controllable marketing variables, in order to seek and Ancash the desired level of sales from their target market (Nuseir and Madanat, 2015:79).
The 4P Marketing Model is a framework that highlights the four major factors of marketing, named as 4Ps – Product, Price, Placement, and Promotion. The basic principle of using 4Ps or marketing mix is designing the company’s strategies, by understanding and meeting the needs and requirements of customers, similarly in this case, where strategy is based on market analysis and segmentation (Nuseir and Madanat, 2015:79). Therefore, APMC will have a Customer-driven strategy, which will help the marketing team and sales force to evaluate and identify the Nigerian market trends, based on the needs and expectations of the B2B companies/customers.
PRODUCT
The product mix is the most important mix/part of the marketing strategy, where, products are advertised on its characteristics, to enhance customer base and product visibility. Every product has unique features, brands, qualities, that distinguish it from other products, which is a relevant to alcohol brand. Product's traits like quality and uniqueness has a primary concern for every B2B customer, Also, product or bottle designs, packaging attracts the customers, which allows customers to purchase new products (Nuseir and Madanat, 2015:79).
As discussed in market segmentation section, there are three main products: RTD, Spirits and Cider, (passing the substantive test), in Nigerian alcohol market and contributing the most in APMC’s total profitability. Therefore, these products are being targeted, while adopting the relevant marketing strategy for APMC. In table 12, 13 and 14 it is discussed that there are 40 customers, together, where only one or two customers in each category were high usage, while all others were low or medium usage customers.
Marketing strategy for the products:
This marketing plan will focus on selling of alcohol products, after Coved 19, in Nigeria, therefore some useful strategies may be:
As a result of Covid and industry’s growing inclination towards digitalization, all players in Nigeria need to be updated and adjusting their marketing and advertising methods, according to the needs of technological needs of the time. In 2020, disruption has been experiences in the availability of products, due to stock up or no import in the country (Olurounbi, 2020).
Therefore, it is recommended for big and small all businesses to get register on the online stores/platforms to sell their alcoholic product. There are a variety of e-commerce sites, which offer more deals after Coved, giving a new vision and life to the market players. Some of these famous sites are: Myshayo.com, Buydrinks.ng, Drinks.ng, Jumia.com.ng and Konga.com. (Milcon Urban, 2017).
Distribution
The concept of place or distribution refers to a product's availability for the customers. Therefore, every business needs to focus and build a strong distribution network and select strategic locations, to make their products available. Distribution strategy is very important tool, used in meeting and the demands of the customers and providing a balance of demand and supply of the key products (Nuseir and Madanat, 2015:79). Due to the COVID-19 outbreak, has forced many B2B consumers to change their buying patterns/behavior, by switching consumption methods. Therefore, alcohol business businesses shifted to online mode, in 2020, in order to avoid exposure to the virus, which has been recorded to be a success, in the entire world, where every country experienced a rapid boost in alcohol e-commerce sales (Furnari, 2020).
In this report, Segmentation is also done on the basis of distribution channel, which is then divided into high users (target 1), medium users (target 2) and low users (target 3), as shown in Table 11. The channels of functions, through which goods and services are made available to consumers, are called to be the marketing channels. Therefore, a marketing channel is a network of interrelated marketing intermediaries/people/bodies that help in flow or transfer of product from producer to end customers or commercial users (Andersen, Weisstein and Song, 2020: 44). But according to data and market analysis, the targets have been shifted, where marketing channels like personal selling, face to face selling, using agents, whole sellers and retailers are recommended on the basis of market conditions of Nigeria and APMC, in order to sell spirits, ciders and RTD.
Selling techniques via online channels (Distribution channel):
According to a new report of Euro monitor International, Nigeria is one of the leading distribution markets in Africa, as it lies among the world's leading independent provider of alcoholic beverages, by using e-commerce channels (Bailey, 2021). Therefore, Nigeria, which is Africa's largest economy, is ranked to be the top five key markets with growth potential, when it comes to making profit.
According to, (Report Linker, 2018) the recommended distribution channels or places of convenience for alcohol products are: Supermarkets, retailers and convenience stores, but since 2020 pandemic, everything is carrying out via social media, so it is suggested for APMC in Nigeria, to increase its social and online availability. Therefore, it is recommended for the company to switch to a social platform, and active distribution (contact free). This will facilitate the online agents to have a smooth distribution channel, where they just need to focus on delivering the products, rather than advertising and selling, as website will mange everything, except delivery.
Promotion- Personal Selling
Promotion in the marketing mix is the marketing tactic, which is used in order to sell the products to the relevant consumer. Promotion is also known as customer -centric communication, which uses different modes of communication and advertising (Nuseir and Madanat, 2015:80). Therefore, the strategy should be focused on the potential customer, while promoting products and services, by APMC. If the 4Ps are designed according to the requirements of the target market, the chances of success are more for APMC to earn more profit (Adams, 2016:6). Promotion and advertising play a huge role in making a product successful and increase the sales revenue. Therefore, the selling team of APMC can use the following promotional activities, in order to remain alive in the customer’s mind, where some useful techniques are:
- Having an active Website with personal assistance: An attractive and easy to use website, always help the customer to reach out easily and quickly, especially in case of B2B customers, where order sizes are big, and customers need more and timely services. A personal assistance can be hired for every big or medium sized customer (usage), in order to cater them, on timely basis.
- Digital marketing emails: Selling team should keep sending regular promotional emails to their valuable B2B customers. The emails must include attractive ads, product details, discount offers, relevant offers and schemes, in order to provide information for high usage customers, and keep their customers updated.
- Social engagement activities with value adding customers: In digital era, the social engagement techniques are helping businesses to sell their products to the right customers. Personal sellers and marketers must track their customer’s social habits and buying patterns, to offer them the suitable products.
- Bulk discounts: Personal sellers must offer discounts, after sales services, value adding information, for their high usage and medium usage B2B customer.
- Customer supporting activities: For high usage and medium usage customers, this can be a very relevant feature, where personal selling team can help them to understand about the product, in a more successful way.
Personal selling and using an active sales force is the basic method used by the company. Usually, alcohol companies in Nigeria, and other countries in Africa, have a very large and active sales team. For this report, it is suggested to adopt the example of sales team of Spendrups (a Sweden company), who runs a big sales force, for personal selling purposes.
Spendrups manufacture, advertise, and distribute wine and beer to B2B businesses, including the wholesalers, retailers and restaurants in Sweden has been referred, with a massive sales force. Although APMC in Nigeria does not need a very big sales force. As the total customers in the RTD, cider and spirits product categories are only 40. Therefore, AMPMC must have a personal sales team of 15 to 20 sales men, who will target the 40 profitable B2B customers in Nigeria. Personal Sales team need to focus on building interaction with the key customers, in order to retain them for a longer time period (ASKSTEDT 2021). Some of the essential strategies to focus well on B2B business relationships are:
- Nigerian Market has faced distribution availability problems after Covid, 19. Therefore, Sales force need to be courteous and need to understand customer’s issues. This can be done by listening customer’s problems, in order to assist them in times of panic, depression and difficulty due to covid 19 (ASKSTEDT 2021). This can also be done by giving faster response to their customers queries, offer them new and continuous discounts, to the customers of all sizes, even on less quantity of litres.
- Personal Services for B2B customers are useful strategies to maintain good terms with the customers. Similarly, APMC in Nigeria must bear the maintenance cost to make their product visible on the bar, stores and supermarkets shelf, where the personal sales team of APMC must visit regularly.
- Personal sales force must need promotional activities like in-house schemes, where publicity should be done on a personal level and external level. Where sales force can target different retailers, convenience stores, restaurants, super marts, whole seller and retailers to offer them with extra schemes, incentives, and promotional deals to sell their products.
Pricing
Price in the marketing strategy refers to the amount being charged for product being offered. In some markets, like alcohol, price has a tremendous impact on the customer perception and psychology and influences their decision or purchase or reorder (Nagle and Müller, 2017). Therefore, the pricing for each product, needs to done, strategically, after an extensive market research. The pricing decision, for a specific product, needs to take into account number of factors, including the industry patterns, customer's choices, brand power, purchasing power of customers, and cost of the product and demand of the products. Furthermore, alcohol policies are developed to regulate the income, sales and prices of the industry. The strategies of a company in alcohol market need to be planned according to the policies of industry, sales and market players in the industry. If the prices are high, the company also has to set higher prices, while it can also offer low prices, to capture more market share (Cheatly, 2021).
Low alcohol prices are a great predictor of high alcohol consumption and alcohol misuse, therefore, governments have a policy to maintain a price level, in order to reduce alcohol-related consumption in Africa, therefore, all players need to set prices, according to the industry patterns (Jernigan and Ross, 2020).
Setting an optimal price setting for alcohol products like Cider and spirits brands, is essential in alcohol business, as brand image is directly linked to the pricing, where the customers get a signal about product quality from its prices. Low price products are perceived to be of lower quality, while expensive products are preferred, by alcohol customers. Therefore, some useful strategies that can be suitable for APMC in Nigeria, in order to acquire maximum market share, may be:
- Price Maximization: Setting an overall high price position, against the competitors, which will be difficult to be matched and acquired (overproof, 2021). This strategy will be highly competitive and will capture customer attention and will be profitable strategy for APMC, in order to attract and retain their B2B customers.
- Price penetration:
After Coved, small companies and even old companies can come up with market penetration schemes, in order to capture more volume, in terms of sales.
- Economical and incentive based pricing
It is a good strategy to capitalize and attract price conscious customers, who like schemes, low prices, gifts, etc, in order to retain with one brand. APMC has a lot of small and low usage customer base; this strategy will help to retain these customers and also to attract more customers.
References
6W Research, 2021. Nigeria Alcoholic Beverage Market (2020-2026), Viewed on: 26th September, 2021, https://www.6wresearch.com/industry-report/nigeria-alcoholic-beverage-market-2020-2026
Adams, M.E., 2016. Beyond the Glass: Examining Wine Tasting Room Profitability Using the 4Ps of the Marketing Mix (Doctoral dissertation, Virginia Tech).
Andersen, P., Weisstein, F.L. and Song, L., 2020. Consumer response to marketing channels: A demand-based approach. Journal of Marketing Channels, 26(1), pp.43-59.
ASKSTEDT.K. 2021. “With Salesforce, we can keep growing our business and help more Swedish restaurants achieve greater success.” Accessed on 29th September, 2021, https://www.salesforce.com/eu/customer-success-stories/spendrups/
Bailey, B. 2021. Nigeria among top 5 growth markets for e-commerce in alcoholic drinks. Viewed on: 30th September, 2021, https://businessday.ng/business-economy/article/nigeria-among-top-5-growth-markets-for-e-commerce-in-alcoholic-drinks/
Dietrich, T., Rundle-Thiele, S., Schuster, L. and Connor, J.P., (2016). A systematic literature review of alcohol education programmes in middle and high school settings (2000-2014). Health Education.
Dietrich, T., Rundle-Thiele, S., Schuster, L., Drennan, J., Russell-Bennett, R., Leo, C., Gullo, M.J. and Connor, J.P., (2015). Differential segmentation responses to an alcohol social marketing program. Addictive behaviors, 49, pp.68-77.
Dolnicar, S., Grün, B. and Leisch, F., (2018). Market segmentation analysis: Understanding it, doing it, and making it useful (p. 324). Springer Nature.
Faria, S. and Ferreira, P., 2021. From the 4 PS to 5 PS: prompt, a new element for the Marketing mix: a specific analysis of the coffee market: the Portuguese market. In Eurasian Business Perspectives: Proceedings of the 29th Eurasia Business and Economics Society Conference (pp. 307-320). Springer International Publishing.
Furnari, C., 2020. Online Alcohol Sales Surge Amid Corona virus Pandemic. Forbes. Viewed on: 28th September, 2021, https://www.forbes.com/sites/chrisfurnari/2020/12/01/online-alcohol-sales-surge-amid-coronavirus-pandemic/?sh=34035c994f3a
Jernigan, D. and Ross, C.S., 2020. The alcohol marketing landscape: Alcohol industry size, structure, strategies, and public health responses. Journal of Studies on Alcohol and Drugs, Supplement, (s19), pp.13-25.
Liu, H.B., McCarthy, B., Chen, T., Guo, S. and Song, X.,(2014). The Chinese wine market: a market segmentation study. Asia Pacific Journal of Marketing and Logistics.
Milcom Urban. 2017. 5 Top ecommerce websites selling alcohol in Nigeria. Viewed on: 25th September, 2021, https://milcomurban.wordpress.com/2017/03/29/5-top-ecommerce-websites-selling-drinks-in-nigeria/
Mziba, B. and Tlapana, T., (2020). Marketing Strategies Employed by a Selected Brewing House in the Greater Buffalo City Metropole. Global Media Journal, 18(34), pp.1-5.
Nadeem, M., 2018. 'Uberization'of Customer Needs With Data Analytics: How Marketing Strategy'Lifts' Products Innovation?. British Journal of Marketing Studies, 6(6), pp.40-58.
Nagle, T.T. and Müller, G., 2017. The strategy and tactics of pricing: A guide to growing more profitably. Routledge.
Nuseir, M.T. and Madanat, H., 2015. 4Ps: A strategy to secure customers' loyalty via customer satisfaction. International Journal of Marketing Studies, 7(4), p.78.
Obot, I.S., 2013. Alcohol marketing in Africa: not an ordinary business. African Journal of Drug and Alcohol Studies, 12(1).
Ochieng, O., 2014. The influence of sales promotion strategies on consumer behaviour in the alcoholic spirits industry in Nairobi central business district (Doctoral dissertation, University of Nairobi).
Olurounbi, R. 2020. Nigeria’s locked-down drinks industry raises bootleg alcohol risks. Viewed on: 23rd September, 2021, https://www.theafricareport.com/25395/nigerias-locked-down-drinks-industry-raises-bootleg-alcohol-risks/
Report Linkers, 2018. Alcoholic Beverages Market by Type and Distribution Channel: Global Opportunity Analysis and Industry Forecast, 2018 – 2025. https://www.reportlinker.com/p05591587/Alcoholic-Beverages-Market-by-Type-and-Distribution-Channel-Global-Opportunity-Analysis-and-Industry-Forecast.html
Statista, 2021. Alcoholic Drinks- Nigeria. Viewed on: 25th September, 2021, https://www.statista.com/outlook/cmo/alcoholic-drinks/nigeria

 Read more +16 February 2026 By Akshay in Blog
How Capstone Project Writing Service Helps University Students
 Read more +09 January 2026 By Akshay in Blog
What is a Dissertation | Elements, Structure & Key Differences

 Read more +08 December 2025 By Akshay in Blog
Practical Tips on How to Make an Essay Longer Effectively
 Read more +28 November 2025 By Akshay in Blog
ASA Format Guide 2025: Essential Tips for Sociology Students to Nail Your Paper Formatting
Get Assignment Help from Me

