Question 1.
The planet may be threatened by climate change due to unsustainable activities, possibly caused by burning fossil fuels (petroleum, natural gas and coal) that produce carbon dioxide (CO2). The table stored in file CO2 EMISSIONS.XLSX (in the course website) lists the top 15 producers of CO2 (millions of metric tonnes) from fossil fuels in 2009 and 2013. Using this data, answer the questions below.
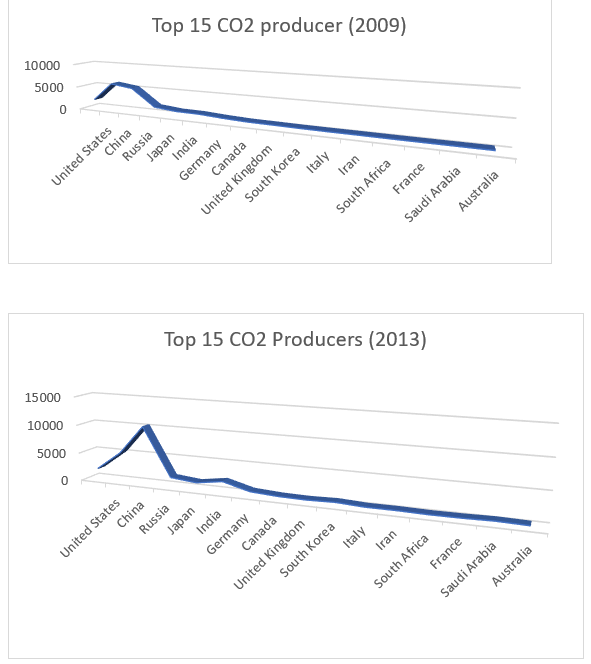
a) Use an appropriate graphical technique to compare the amount of CO2 emissions (in millions of metric tonnes) in 2009 and 2013, broken down by the producer countries.
(b) Use an appropriate graphical technique to compare the percentage value of the amount of CO2 emissions (in %) in 2009 and 2013, broken down by the producer countries.
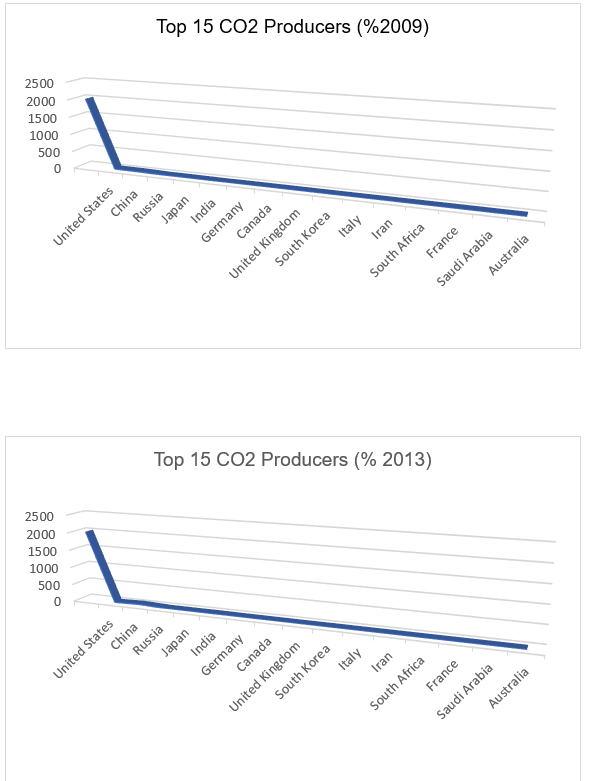
(c) Comment your observations in parts (a) and (b).
In part a, in the year 2009 for every country the CO2 emissions are higher than in the year 2013 except for China where in 2009 the emission in 2009 is 532.77 whereas in 2013 it is 5300.
In part b, when percentage was calculated during both the years CO2 emissions were decreasing except for China and USA.
Question 2.
The amount of time (in seconds) needed for assembly-line workers to complete a weld at a car assembly plant in Adelaide was recorded for 40 workers.
59 60 81 74 68 66 49 76 63 67 69 35 65 61 43 72 83 65 69 70 54 61 38 92 72 74 55 63 69 73 75 47 60 62 68 51 71 73 68 99
- Construct a frequency distribution and a relative frequency distribution for the data.
|
Classes
|
Frequency
|
Relative frequency
|
|
35-45
|
3
|
0.075
|
|
45-55
|
3
|
0.075
|
|
55-65
|
10
|
0.25
|
|
65-75
|
18
|
0.45
|
|
75-85
|
4
|
.1
|
|
85-95
|
1
|
0.025
|
|
95-105
|
1
|
0.025
|
Total 40 1
- Construct a cumulative frequency distribution and a cumulative relative frequency distribution for the data.
|
Classes
|
Cumulative Frequency
|
Cumulative Relative frequency
|
|
35-45
|
3
|
0.075
|
|
45-55
|
6
|
0.15
|
|
55-65
|
16
|
0.4
|
|
65-75
|
34
|
0.85
|
|
75-85
|
38
|
0.95
|
|
85-95
|
39
|
0.975
|
|
95-105
|
40
|
1
|
c) Plot a relative frequency histogram for the data.
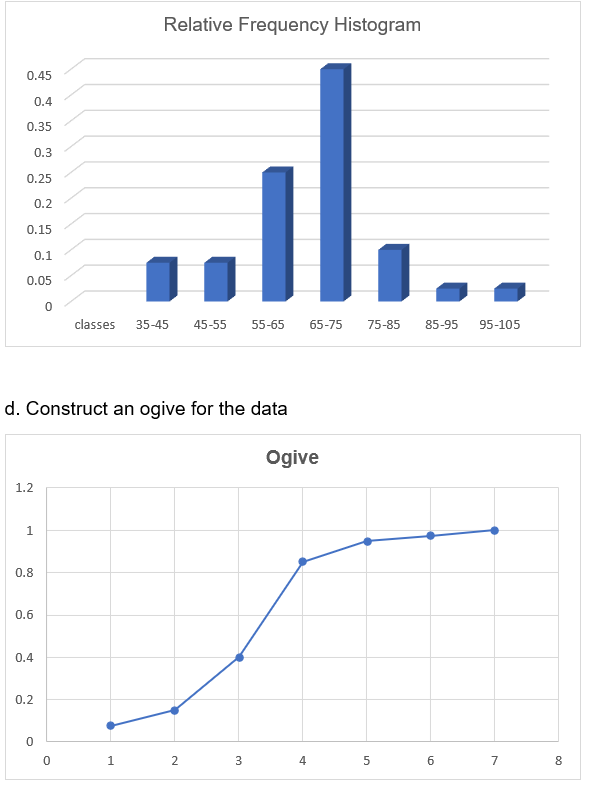
e) What proportion of the data is less than 65?
37.5% proportion of the data is less than 65
f) What proportion of the data is more than 75?
12.5% proportion of the data is more than 75
Question 3.
Because inflation reduces the purchasing power of the dollar, investors seek investments that will provide protection against inflation; that is, investments that will provide higher returns when inflation is higher. It is frequently stated that ordinary shares provide just such a hedge against inflation.
- Using an appropriate graphical descriptive measure (relevant for time series data) describe the two variables.
Rate of Inflation (Line Chart):

In the above diagram we can see that there many fluctuations in the inflation rate over the period from 1990 to 2015; in 1996 it was 4.6% where as in 1998 it was 0.3%.
All Ordinaries Index:
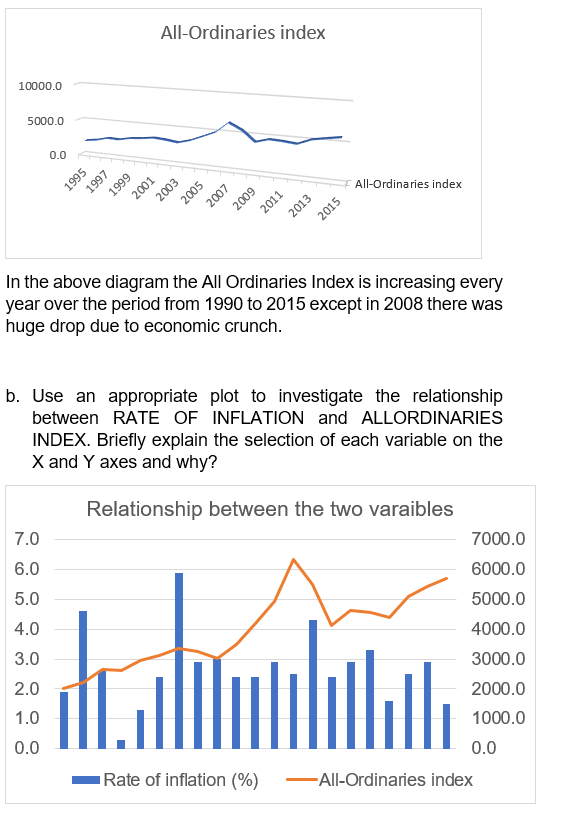
The dependent variable will be All Ordinary Index and the dependent will be inflation rate because investors need higher returns when inflation is increasing. Due to inflation the purchasing power of the people decrease so in order to prevent themselves against hyperinflation, the investors invest in AOID’s.
- Prepare a numerical summary report about the data on the two variables by including the summary measures, mean, median, range, variance, standard deviation, and coefficient of variation, smallest and largest values, and the three quartiles, for each variable
|
|
Summary Report
|
|
|
|
Inflation Rate
|
All Ordinaries Index
|
|
mean
|
2.7
|
3982.733333
|
|
median
|
2.5
|
4127.6
|
|
range
|
5.6
|
4336.8
|
|
variance
|
54.66126984
|
|
|
std
|
1.193274806
|
1237.248245
|
|
coefficient variation
|
44.35180694
|
31.0653047
|
|
Smallest value
|
0.3
|
2000.8
|
|
Largest value
|
5.9
|
6337.6
|
|
3rd quartile
|
2.95
|
5022
|
Calculate the coefficient of correlation (r) between RATE OF INFLATION and ALL-ORDINARIES INDEX. Then, interpret it.
The correlation of coefficient between the true variables in 0.038
Which is equivalent to 0 so this means there is no relationship between the two because correlation ranges from -1 to +1; -1 means negative relationship and +1 means perfect positive relationship but 0 means no relationship.
- Estimate a simple linear regression model and present the estimated linear equation. Then, interpret the coefficient estimates of the linear model.
The formula for simple linear equation is:
Y= a + bX+ e
So, when we write as an equation:
AOIDs = a + b*(inflation rate)
For the year 1997
AOIDs = 4130.6 + -17.86* (2.6) = 4084.16
For the year 1998
AOIDs = 4130.6 + -17.86*(0.3) = 4125.24
This shows that for each percentage decrease in inflation rate the index share increases.
|
|
|
|
Regression Statistics
|
|
|
|
|
|
| |
|
|
|
|
|
|
|
|
|
Multiple R
|
0.018311102
|
|
|
|
|
|
|
|
|
R Square
|
0.000335296
|
|
|
|
|
|
|
|
|
Adjusted R Square
|
-0.055201632
|
|
|
|
|
|
|
|
|
Standard Error
|
1212.946808
|
|
|
|
|
|
|
|
|
Observations
|
20
|
|
|
|
|
|
|
|
| |
|
|
|
|
|
|
|
|
|
ANOVA
|
|
|
|
|
|
|
|
|
|
|
df
|
SS
|
MS
|
F
|
Significance F
|
|
|
|
|
Regression
|
1
|
8882.406
|
8882.406
|
0.006037361
|
0.938923547
|
|
|
|
|
Residual
|
18
|
26482319
|
1471240
|
|
|
|
|
|
|
Total
|
19
|
26491202
|
|
|
|
|
|
|
| |
|
|
|
|
|
|
|
|
|
|
Coefficients
|
Standard Error
|
t Stat
|
P-value
|
Lower 95%
|
Upper 95%
|
Lower 95.0%
|
Upper 95.0%
|
|
Intercept
|
4130.609101
|
683.8675
|
6.040072
|
1.03831E-05
|
2693.856847
|
5567.361354
|
2693.856847
|
5567.361354
|
|
Inflation Rate
|
-17.867802
|
229.9575
|
-0.0777
|
0.938923547
|
-500.9905874
|
465.2549825
|
-500.9905874
|
465.2549825
|
| |
|
|
|
|
|
|
|
|
|
- Determine the coefficient of determination R2 and interpret it.
The R squared for this equation is below zero which means that the relationship between the two is not good fit
- Test the significance of the relationship at the 5% significance level.
The significance level is above 0.05 which means that another independent variable should be used.
- What is the value of the standard error of the estimate (se). Then, comment on the fitness of the linear regression model?
The value of standard error is 1212.94
A large standard deviation means that there is variability in the mean and that the sample mean is away from the population mean. Population mean is inflation and sample mean is all ordinaries index.
References:
Best Excel Tutorial (2019), ‘Ogive charts’, viewed on 26 August 2019, <https://best-excel-tutorial.com/56-charts/388-ogive-charts>.
Excel Jet (2019), ‘Excel FREQUENCY Function, viewed on 28 August 2019, <https://exceljet.net/excel-functions/excel-frequency-function>
Cheusheva S. (2019), ‘Linear Regression Analysis in Excel’, Ablebits.com, viewed on 28 August 2019, 25 July <https://www.ablebits.com/office-addins-blog/2018/08/01/linear-regression-analysis-excel/>.
Crocker T. (2015), ‘Create a chart with Date or Time Data’, Pryor Learning Solutions’, 11 June, viewed on 28 August 2019, <https://www.pryor.com/blog/create-a-chart-with-date-or-time-data/>.
Stephanie (2014), ‘Relative Frequency Histogram: Definition and How to Make One’, Statistics How To, 30 January, viewed on 27 August 2019, <https://www.statisticshowto.datasciencecentral.com/relative-frequency-histogram-2/>.
Extend Office (2019), ‘How to calculate the Correlation Coefficient between two variables in Excel’, viewed on 26 August 2019, <https://www.extendoffice.com/documents/excel/4152-excel-calculate-correlation-between-two-variables.html>


