“Investment Decision based on Ratio Analysis for a company during a 2-year period”
1. Introduction and background of the industry
The banking industry deals in a range of products and services, from offering banking services to giving loans (Easa, 2019). Also, banking industry helps and provide services like: cash transfer, currency exchange, where a whole chain of banks is available to cater all customers (FDIC, 2018).
In second quarter of 2021, the banking sector's market capitalization was about 7.4 trillion euros, which has increased from 6.8, in 2016, shown in Figure 1 (Norrestad, 2021). There are more than 100 global market players (CFI, 2021).
Figure 1: Market Capitalization of Banking Industry
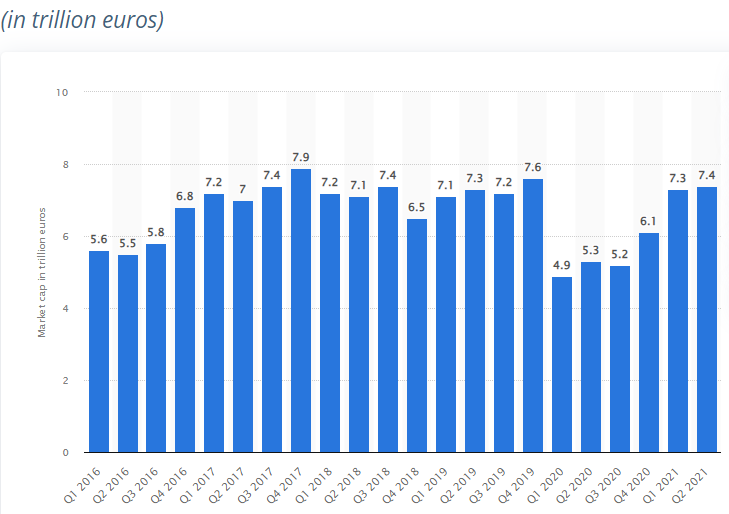
(Source: Norrestad, 2021).
In 2020, banking industry faced Covid crises, which caused credit losses, throughout the global economy and demand for banking services declined, consequently, all banks were impacted (Mc Kinsey & Co., 2020). Currently, industry is under recovery stage, (figure 2-Appendix). To be specific, this report will focus on UK banking industry. According to (Norrestad, 2021), the total market capitalization of UK banking industry, shown in figure 3:
Figure 3: Market capitalization of UK Banks
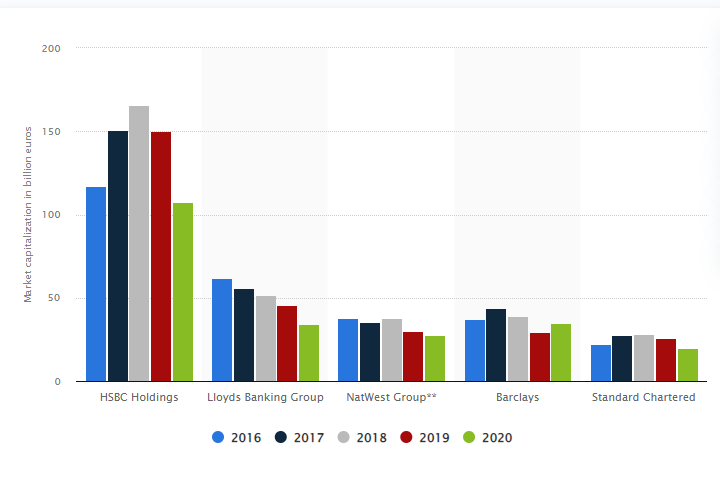
(Source: Norrestad, 2021).
UK banking industry is dependent on its Big Four Payers: RBS, Barclays, HSBC, and Lloyds Banking Group, who covers 80% of the customer base in UK. Currently, there are almost 80 million customer accounts, 20 banks (Ahmed, Bangassa and Akbar, 2020).
2. Introduction and background of the company within the industry
This report focusses on Barclay PLC, which is the one of the largest banks in UK, having a market capitalization of more than $30 billion and PBT of 3065 million euros, shown in figure 4. Also, it is among Europe's top 10 banks, shown in figure 11 (Appendix) (Norrestad, 2021).
Figure 4: PBT of Barclays
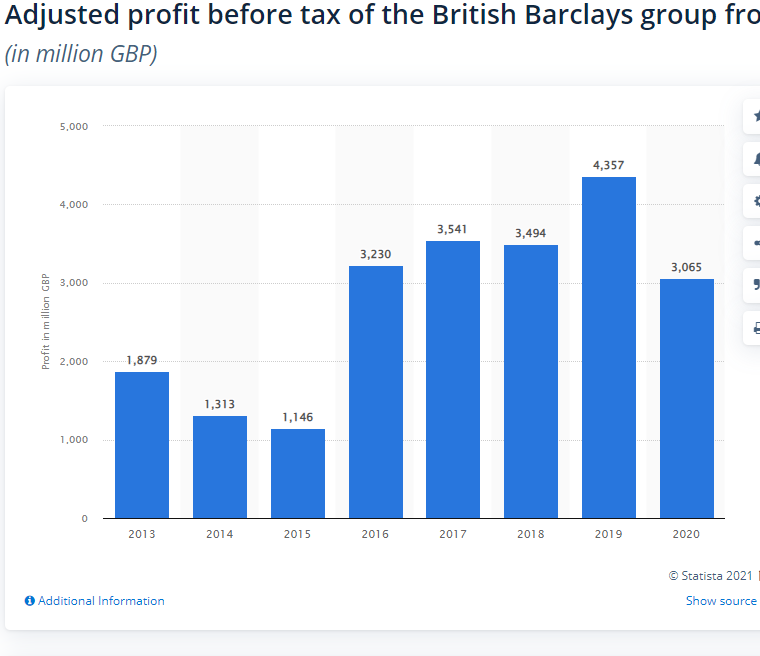
(Source: Norrestad, F., 2021).
Recently, Barclays' 2021's Profit before tax (PBT) is recorded to be $2.8 billion, which is double than 2020's profit, which makes the bank to standout in the industry (White, and Wither, 2021). The history of Barclays Bank can be traced back to 1690, which started in London, and by 1736, was renamed to be Barclays. The bank grew significantly, and was ranked as the seventh largest bank on the list of Europe's largest banks in 2018 (Norrestad, 2021). According to (Google Finance, 2021), the financial performance of Barclays Plc got affected in 2020, due to Covid 19, shown in figure 5, where revenue decreased by 13.53% and NI decreased by 27.21%. Also, Barclays posted a full-year profit of £1.53 billion or $2.11 billion, which is 38% less than the previous year, but far beyond the financial analyst predictions (Smith, 2021).
Figure 5: Revenue and Income of Barclays Plc.
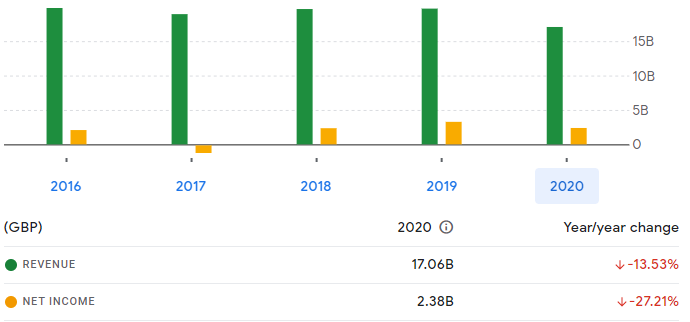
(Source: Google Finance, 2021).
3. Qualitative Analysis
In terms of qualitative analysis, different KPIs and facts will be reviewed. In 2018, Barclays Head Office employed 48.5 thousand employees (Norrestad, 2021), which reduced to 47.8 and 47.7 in 2019 and 2020, respectively, shown in figure 6. (Barclay, Plc, 2020).
Figure 6: Employee Distribution of BT Group
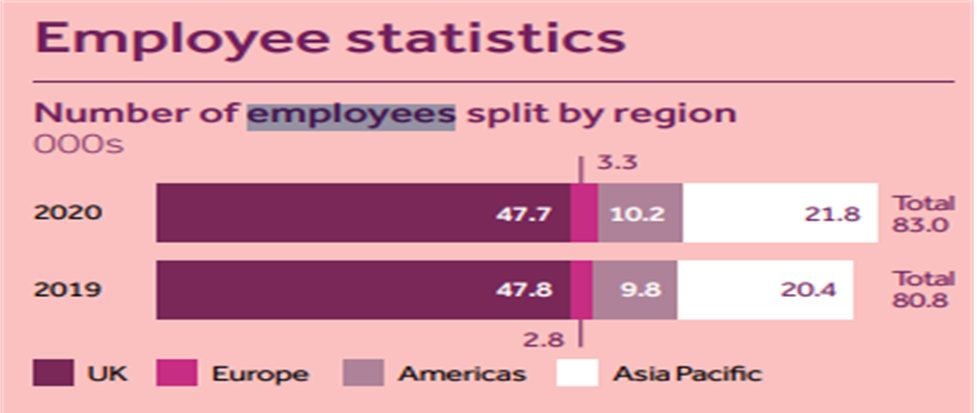
(Source: Annual Report, 2020)
According to qualitative analysis, financial and ethical integrity was maintained in 2020, where the Group Profit before Tax (PBT) was £3.1 billion, showing the Group presented a sustainable performance, despite the world economy's recession. According to Chairman and CEO's reports, it can be revealed Group's performance is satisfactory (Barclay Plc, 2020), shown in figure 7:
Figure 7: Income of BT group
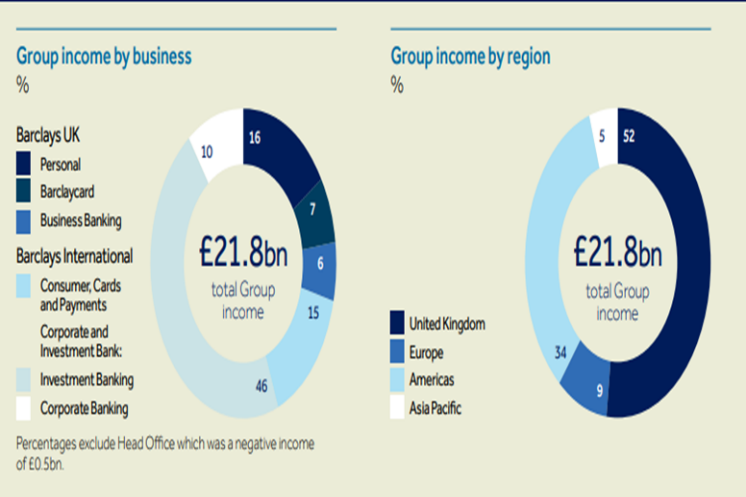
(Source: Annual Report, 2020)
Additionally, a mix of key performance indicators are used to analyze the operating success of the group. Some of the non-financial indicators can be: Colleague engagement which is 83% (2020), increased from 77% (2019) in times of Covid 19. Job satisfaction rate of employees increased from 92% to 94% in 2020 (Barclay Plc, 2020). Also, the customer digital engagement ratio has increased from 71% (2019) to 71.4% (2020).
According to the director report, BT group improved its customers' experiences, via offering different reward, customer support and incentive programs, in 2020. According to the auditor’s report, the financial statements presented a fair, balanced, and understandable report. Therefore, financial reports have been prepared, based on going concern and long-term viability concept, which provide evidence that company will be going concern, for next three years. Similarly, the share price analysis presents the share price of Barclays (BARC) was 179.64 in 2019, 146.68 in 2020 and 195.50 in 2021, shown in figure 8 (Hargeaves Landson, 2021), which shows a positive indication for the investors.
Figure 8: Share Price of Barclays (BARC)
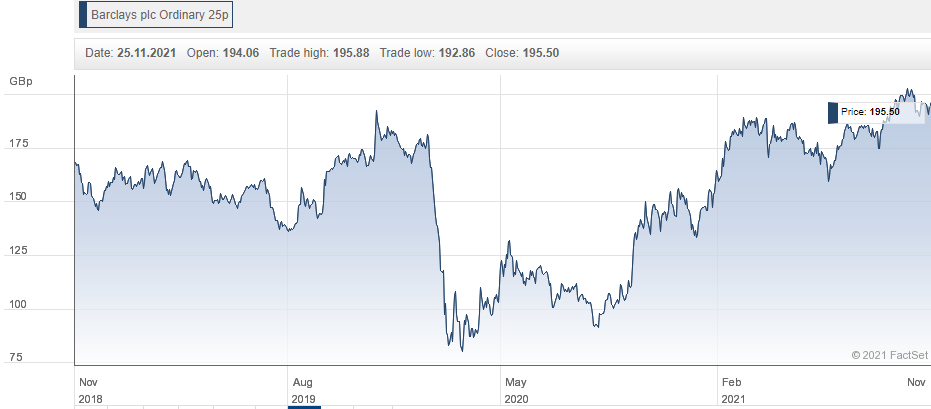
(Hargeaves Landson, 2021).
Read More
4. Two years ratios including various groups
Table 1: Ratios for two Years (Calculated in Excel)
|
Barclays Plc- Ratio Analysis
|
|
|
|
2020
|
2019
|
|
|
Liquidity ratios
|
|
|
|
1
|
Current ratio
|
1
|
0.492523
|
|
|
|
|
|
|
|
Profitability ratios
|
|
|
|
2
|
Profit Before Tax (PBT) Ratio
|
14.08%
|
20.14%
|
|
3
|
Net profit (NP) Margin
|
11.31%
|
15.51%
|
|
4
|
Operating profit (OP) margin
|
13.975%
|
19.813%
|
|
5
|
Return on equity (ROE)
|
3.68
|
5.11
|
|
6
|
Return on asset (ROA)
|
0.182
|
0.294
|
|
|
|
|
|
|
|
Solvency ratio
|
|
|
|
7
|
Total Debt to Equity
|
2.6
|
2.58
|
|
8
|
Debt ratio
|
0.129024
|
0.148556
|
|
9
|
Operating
expense ratios
|
0.63796
|
0.71348
|
|
|
|
|
|
|
|
Activity Ratios
|
|
|
|
10
|
Asset Turnover ratio
|
0.016129
|
0.018972
|
|
|
|
|
|
|
|
Market valuation Ratios
|
|
|
|
11
|
P/E ratio
|
16.7
|
12.6
|
|
12
|
EPS
|
9.5p
|
24.4p
|
|
13
|
Dividend yield ratio
|
2.05%
|
3.90%
|
5. Comparative analysis of the financial performance of the firm over 2-year period
The financial statement is an essential document, that provides information for all stakeholders: Shareholders, investors, employees, clients, competitors, etc., regarding to an organization's financial health and productivity of the company (Jayawardhana, 2016). The overall financial performance of Barclays, in 2019 and 2020 is presented in figure 9:
Figure 9: Revenue to earning comparison
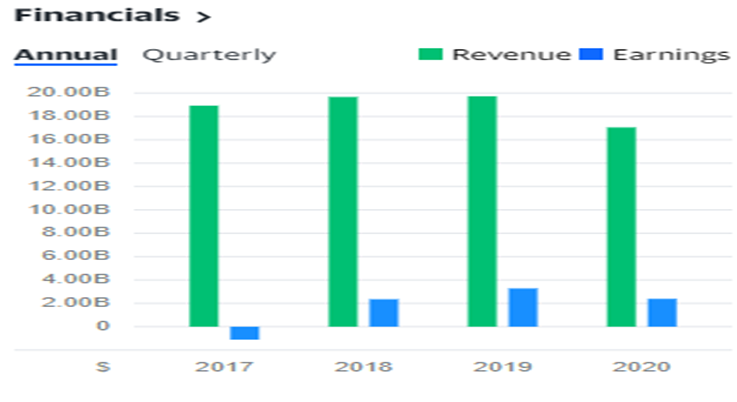
(Source: Yahoo Finance, 2021).
Similarly, this report presents a ratio analysis for Barclays Plc., to understand its financial performance for the years of 2019 and 2020, where the important areas of analysis are:
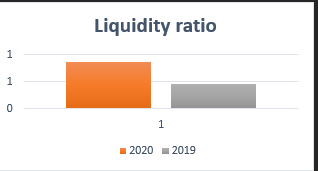
1. Liquidity Ratios
Liquidity ratios reflects bank capacity to meet its short-term obligations and remains going concern. Current Ratio is an important ratio, which measures whether a bank has adequate cash and cash equivalents to meet its short-term obligations. The current ratio of BARC was calculated to be 0.49, for 2019, which increased to 1, in 2020, which is less than the required ratio, presented in chart 1. The current ratio of a good bank, in normal conditions must be more than 1 (Ibe, 2013). Ratio less than 1, indicates that the bank's capacity to cover its short-term liabilities can be uncertain.
Chart 1: Liquidly Ratios
2. Profitability Ratios
The profitability ratios reflect a company's overall efficiency, while using its assets and enhance its performance (Rahman, 2017). There are two types of profitability ratios: profit margin ratios and return ratios, as calculated for Barclays (BARC), in the previous section.
a. Profit Margins
The PBT ratio has declined from 20.14% in 2019, to 14.08%, in 2020, which is understandable, as every business faced difficulty in 2020, due to Covid 19. Net profit margin, is calculated to be 15.51% in 2019, which reduced to 11.31%, in 2020. This indicates that revenue was less, while expenses and taxes were same. Similarly, OP Margin was 19.81% for 2019, which also reduced to 13.98%, in 2020, shown in chart 2:
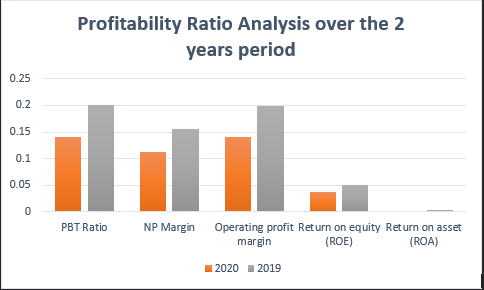
Chart 2: Profitability and return analysis
b. Return Ratios
Return on equity (ROE) for Barclays Plc. is calculated to be 3.68 in 2020, and 5.11 in 2019. For the investors of public bank, ROE is very crucial, as it calculates the return on investment, the company earned for its investors. It's the ratio that potential investors, always consider when deciding whether to invest in the company. While, the return on assets (ROA) ratio for BARC was 0.182, in 2020, and 0.294, in 2019. It calculates the amount of profit earned on the total assets. Therefore, it can be said that the return earned on resources employed, reduced in 2020, as compare to 2019, shown in chart 2.
3. Solvency ratios
According to (Rahman, 2017), solvency refers to a company's capacity to meet its long-term obligations, which include both interest and principal value of debt. Solvency ratios include gearing or debt ratio, expenses ratio and debt to equity ratios.
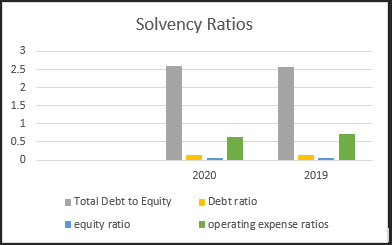
Chart 3: Solvency ratios
a. Debt to Equity (D/E ratio)
Usually the D/E ratio is between 1 to 1.5, but this varies from industry to industry. For banking industry, ratios are higher than 2, as banks have huge amounts of debts. Similarly, the D/E ratios for Barclays (BARC) is higher than 2, in both the years, shown in chart 3, which is a good sign.
b. Debt ratio (DR)
A debt ratio measures the amount of leverage used by the bank, in terms of total debt to total assets. If a debt ratio is greater than 1 or 100%, it means that a company has more debt than total assets. In this case, the DR in 2020 is 0.129, while for 2019, DR is 0.148, which means that Barclays Plc. has more assets than its debt.
c. Operating expense (OE) ratios
The operating expenses ratio are calculated to be 0.7135 or 71.35% in 2019, which decreased to 0.638 or 63.8%, in 2020. The operating expense ratios should be less, usually, ranging from 60% to 80%. Therefore, BARC has a satisfactory level of OE ratio in 2019, which further improved in 2020.
4. Activity Ratios
An activity ratio is used to show the efficiency of the company (Gamayuni, 2015). In this report, Asset Turnover ratio has been calculated for Barclays Plc. A company's ability to generate revenue from its assets is measured by this ratio, where a low asset turnover ratio, suggests that a bank is not effectively utilizing its resources to generate sales. In 2019, Asset turnover is calculated to be 1.89 and reduced to 1.61, in 2020, as banks got less chances to invest money in new projects, due to economic turmoil, shown in chart 4:
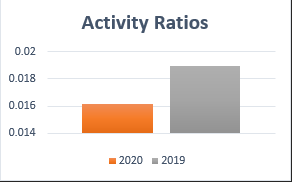
Chart 4: Activity ratios
1. Market return ratios
Market return ratios are also called investment or valuation ratios, which are essential for shareholders and investors, to understand how beneficial is it to invest in the bank/company. The important ratios, under this head are:
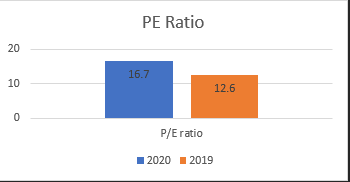
a. P/E ratio
The price to earnings (P/E ratio) indicates the willingness of the market to pay for the company's earnings (Afza and Tahir, 2012). Higher P/E ratio indicates that the market is willing to pay more for the company's earnings, where P/E ratio between 12 to 15 is considered reliable. From calculation made in the previous section, the P/E ratio for 2019 was 12.6, which increased to 16.7 in 2020, which is an attractive figure for the investors, shown in chart 5:
Chart 5: P/E Ratio for 2019 and 2020
b. Earnings Per share (EPS)
EPS is an indicator, used for measuring the value of the firm, by calculating the return company offers to its investors, for each share (Talamati and Pangemanan, 2015). From calculation and figures provided in the annual report, the EPS for the bank was 24.4 in 2019, which reduced to 9.5, in 2020 (Figure 12-Appendix), shown in chart 6, which shows a massive dip.
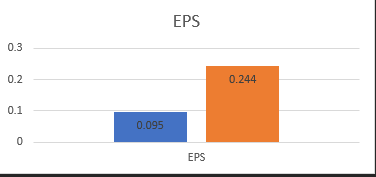
Chart 6: EPS of 2019 and 2020
c. Dividend Yield Ratio
The dividend yield ratio measures company's trend of paying dividends, each year compared to the stock prices. The DYR was 3.90% in 2019, which reduced to 2.05%, in 2020, shown in chart 7:
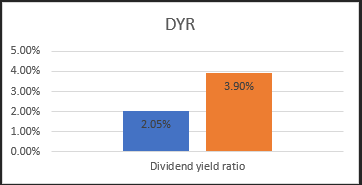
Chart 7: DYR for 2019 and 2020
6. Comparative analysis of the company vis-a-vis the industry.
The financial performance of all banks, is a tool to assess the health of the overall industry’s performance. The banking industry is growing continuously. Despite this progress, banking institutions encounters challenges, based on internal performance and external factors like: Globalization, competition, and unstable market conditions, etc. (Adam, 2014). The ratios calculated will be analyzed, in relation to the UK industry benchmarks/averages.
Profitability ratios are the key performance indicators used to understand the the financial performance of the bank, in relation to the industry. Therefore, Barclay’s profitability ratios have been compared to industry ratios, in the table 2:
Table 2: BARC vs UK industry
|
Ratios
|
2020
|
2019
|
Industry
|
|
PBT Ratio
|
14.0816
|
20.14146
|
15.66
|
|
NP Margin
|
11.30663
|
15.50481
|
10.27
|
|
Operating profit margin
|
13.97593
|
19.81324
|
15.66
|
|
Return on equity (ROE)
|
3.679615
|
5.108133
|
3.33
|
|
Return on asset (ROA)
|
0.182362
|
0.294151
|
0.29
|
(Source: Investing. Com, 2021)
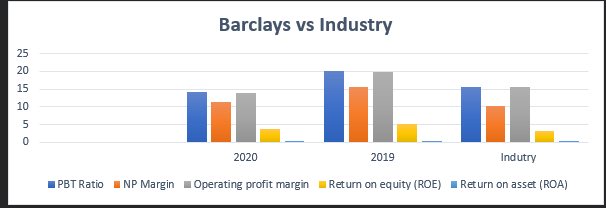
Based on table, Barclays is performing well, compared to the average ratios for the UK banking industry, where, PBT ratio was 14.08 in 2020, which is not very low than the industry ratio of 15.66. Also, industry averages have been calculated for five years period, and may differ for each year. Whereas, in 2019, PBT was more than the industry benchmark. Similarly, NP margin is calculated as 15.5 in 2019 and 11.3 in 2020, which is more than the industry average of 10.27, which means that the bank is performing well, as compared to the overall market.
Return on equity (ROE), is also an important indicator, for shareholders and investors, where the industry average ratio is of 3.33, whereas, Barclays’s Plc. was offering far more ROE of 5.11 in 2019 and 3.68 in 2020. Also, ROA for industry is 0.29, which is equal to 2019’s ROA ratio of the bank, which reduced in 2020, due to Covid 19, presented in the chart 8, below:
Chart 8: Barclays and Industry comparison
Furthermore, the banking industry has an average Dividend yield ratio of 3.22%, while Barclays Plc. has a ratio of 3.90% in 2019, which was comparatively better than industry average. Similarly, EPS is recorded to be 0.1 for the banking industry, whereas BARC. has an EPS of 0.244 in 2019, which is a very good return for the investors, but the performance got impaired in 2020, due to economic crises, caused by Covid 19. Similarly, the liquid ratios of the bank are relatively lower than the industry rates, and need to be considered, while gearing ratios present a satisfactory picture. Lastly, valuation ratios, which are an attractive feature, of any industry and company, from investors and shareholder’s perspective is presented in Table 3 and Chart 9:
Table 3: Valuation Analysis of industry vs Barclays
|
Investment/valuation
|
2020
|
2019
|
Industry
|
|
P/E ratio
|
16.7
|
12.6
|
11.53
|
|
EPS
|
0.095
|
0.244
|
0.1
|
|
Dividend yield ratio
|
2.05%
|
3.90%
|
3.22%
|
(Source: MSCI, 2021; Barclay dividend Yield, 2021)
Chart 9: Investment Analysis of Barclays vs Industry
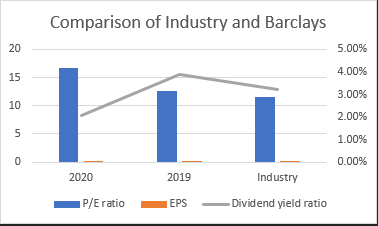
Based on Table 3, the average Payout ratio of UK banking industry is 11.53, while, BARC recorded a ratio of 12.6 in 2019, which increased to 16.7 in 2020, which makes the corporate bank very attractive, from investment perspective. Similarly, industry EPS is 0.1, whereas, Barclays Plc. recorded an EPS of 0.244, which is more than the industry average and in 2020, the EPS figure is still not very low. Also, DYR is 3.22% for the whole industry, which was out performed by BARC in 2019, shown in the chart 9. Overall, Barclay Plc is a promising and profitable bank of the UK banking industry and a good option from investment purposes.
References
Adam, M.H.M., 2014. Evaluating the Financial Performance of Banks using financial ratios-A case study of Erbil Bank for Investment and Finance. European Journal of Accounting Auditing and Finance Research, 2(6), pp.162-177.
Afza, T. and Tahir, S., 2012. Determinants of price-earnings ratio: the case of chemical sector of Pakistan. International Journal of Academic Research in Business and Social Sciences, 2(8), p.331.
Ahmed, S., Bangassa, K. and Akbar, S., 2020. A study on trust restoration efforts in the UK retail banking industry. The British Accounting Review, 52(1), p.100871.
Barclay dividend Yield, 2021. Dividend ranking. Viewed on: 28th November, 2021, http://www.dividendsranking.com/Barclays-dividend-yield.html
Barclays Plc, 2020. Making a difference Barclays PLC. Annual Report 2020.
CFI, 2021. Key Players in the Capital Markets. Bank, Institutions, Corporations and Public Accounting. Viewed on: 21st November, 2021,https://corporatefinanceinstitute.com/resources/careers/companies/key-players-in-capital-markets/
Easa, N.F., 2019. Knowledge management at banking industry: a review of the literature and further guidelines. International Journal of Customer Relationship Marketing and Management (IJCRMM), 10(2), pp.21-34.
FDIC, 2018. International banking. RMS Manual of Examination Policies 11.1-1. Federal Deposit Insurance Corporation. Viewed on: 22nd November, 2021,https://www.fdic.gov/regulations/safety/manual/section11-1.pdf
Gamayuni, R.R., 2015. The effect of intangible asset, financial performance, and financial policies on the firm value. International Journal of scientific and technology research, 4(1), pp.202-212.
Google Finance, 2021. Barclays PLC. Financial Performance. Viewed on: 23rd November, 2021,https://www.google.com/finance/quote/BARC:LON?sa=X&ved=2ahUKEwiv-oWXvLD0AhWZSfEDHdnwA6sQ3ecFegQIDhAe
Hargeaves Landson, 2021. BARCLAYS PLC (BARC). Viewed on: 26th November, 2021,https://www.hl.co.uk/shares/shares-search-results/b/barclays-plc-ordinary-25p
Ibe, S.O., 2013. The impact of liquidity management on the profitability of banks in Nigeria. Journal of Finance and Bank Management, 1(1), pp.37-48.
Investing. Com, 2021. Barclays PLC (BARC). Viewed on: 26th November, 2021, https://uk.investing.com/equities/barclays
Jayawardhana, A., 2016. Financial performance analysis of Adidas AG. European journal of business and management, 8(11), pp.74-82.
Mc Kinsey & Co., 2020. McKinsey’s Global Banking Annual Review. Viewed on: 20th November, 2021,https://www.mckinsey.com/industries/financial-services/our-insights/global-banking-annual-review
MSCI, 2021. MSCI Europe Banks Index (EUR). Viewed on: 27th November, 2021, https://www.msci.com/documents/10199/e72ea9be-ae79-4bb5-8ce0-054d4f371549
Norrestad, F., 2021. Adjusted profit before tax of the British Barclays group from 2013 to 2020. Viewed on 27th November, 2021, https://www.statista.com/statistics/294735/barclays-insurance-profit-before-tax/
Norrestad, F., 2021. Barclays Bank - statistics & facts. Statista. Viewed on: 22nd November 2021,https://www.statista.com/topics/3913/barclays-bank/#dossierKeyfigures
Norrestad, F., 2021. Largest banks in the UK. Statista. Viewed on: 22nd November, 2021,https://www.statista.com/topics/6033/leading-uk-banks/#dossierKeyfigures
Norrestad, F., 2021. Largest banks in the United Kingdom (UK) from 2016 to 2020, by market capitalization. Viewed on: 25th November, 2021,https://www.statista.com/statistics/937768/leading-banks-in-the-united-kingdom-by-market-capitalization/
Norrestad, F., 2021. Market capitalization of banking sector worldwide 2016-2021. Statista. Viewed on: 21st November, 2021, https://www.statista.com/statistics/265135/market-capitalization-of-the-banking-sector-worldwide/
Rahman, A.A.A.A., 2017. The relationship between solvency ratios and profitability ratios: Analytical study in food industrial companies listed in Amman Bursa. International Journal of Economics and Financial Issues, 7(2), pp.86-93.
Smith, E., 2021. Barclays reports 38% slide in net profit for 2020, resumes dividend payouts. CBNC. Viewed on: 24th November, 2021,https://www.cnbc.com/2021/02/18/barclays-q4-2020-earnings.html
Talamati, M.R. and Pangemanan, S.S., 2015. The effect of earnings per share (eps) & return on equity (roe) on stock price of banking company listed in Indonesia stock exchange (idx) 2010-2014. Journal EMBA: Journal Riset Ekonomi, Manajemen, Bisnis dan Akuntansi, 3(2).
White, L., and Wither, L. 2021. Barclays third quarter profit doubles amid global merger frenzy. Reuters. Viewed on: 24th November, 20921, https://www.reuters.com/world/uk/barclays-q3-beats-expectations-strong-investment-bank-performance-2021-10-21/


