Analysis of “BHP” Financial Performance Assessment 3
Group Assessment
INTRODUCTION
This is the Assessment type 3 based on group assessment. The purpose of this assessment is to study financial performance and details of any company listed on the ASX and here the company selected is the BHP. Then carry out financial research and analysis in the field of business finance encompassed in the course. This assignment examines the key problems consist of primary theories, implement performance analysis and examine the BHP financial performance based on different financial ratios. BHP is a world-leading resources company with market capitalization of $ 119.16 billion (Listcorp, n.d).
FINANCIAL PERFORMANCE ANALYSIS OF THE SELECTED COMPANY
We have selected the BHP for financial analysis and academic research. Below is mentioned the details of the financial performance analysis:
a) Description of the company
BHP is a major mineral corporation worldwide. Previously known as BHP Billiton. The products are traded throughout the world, with sales and marketing in Singapore and Houston, USA. BHP's headquarters are situated in Melbourne, Australia. BHP functions under a dual listed company structure with two parent companies (BHP Group Limited and BHP Group Plc) functioning as if they were a single economic group and are controlled by an integrated board of management (Listcorp, n.d).
It was established in the year 1885 in the remote mining town of Broken Hill in New South Wales, by 2017 BHP was listed as the major mining company, based on market capitalization. BHP Billiton was formally named in 2001. With over 72,000 workforces and several contractors, BHP extracts minerals, oil and gas, and processes them (BHP, n.d.b). Its products are produced all across the world, with business development driven by Singapore and Houston. The goal is to put together resources and people to create a better world. The strategy of BHP is to deliver the best resources, the best materials and the best properties, long-term stability and high returns.
BHP Values
The basic values of BHP are sustainability, truthfulness, esteem, performance, easiness and responsibility (BHP, n.d.c).
BHP Businesses
There are various businesses in which BHP is operating (BHP, n.d.a). These businesses are as follows:
- Minerals Australia
The group of assets for Minerals Australia involves operated assets in Western Australia, Queensland, New South Wales, and South Australia. The assets revolve around copper, iron ore, coal and nickel.
- Minerals Americas
The group of assets for Minerals Americas incorporates plans, operated and non-operated assets in Canada, Chile, Peru, the US, Colombia and Brazil. Copper, zinc, iron ore, coal, and potash are these assets and projects.
The Petroleum unit includes conventional oil and gas processes, exploration, production and marketing in the US, Australia and Trinidad and Tobago.
- Marketing
Marketing is BHP's self-reliant primary business. It is the connection between the global operations of BHP and their global clients.
- Global locations
The businesses of BHP are working in multiple global locations with corporate and marketing offices for other assets and projects.
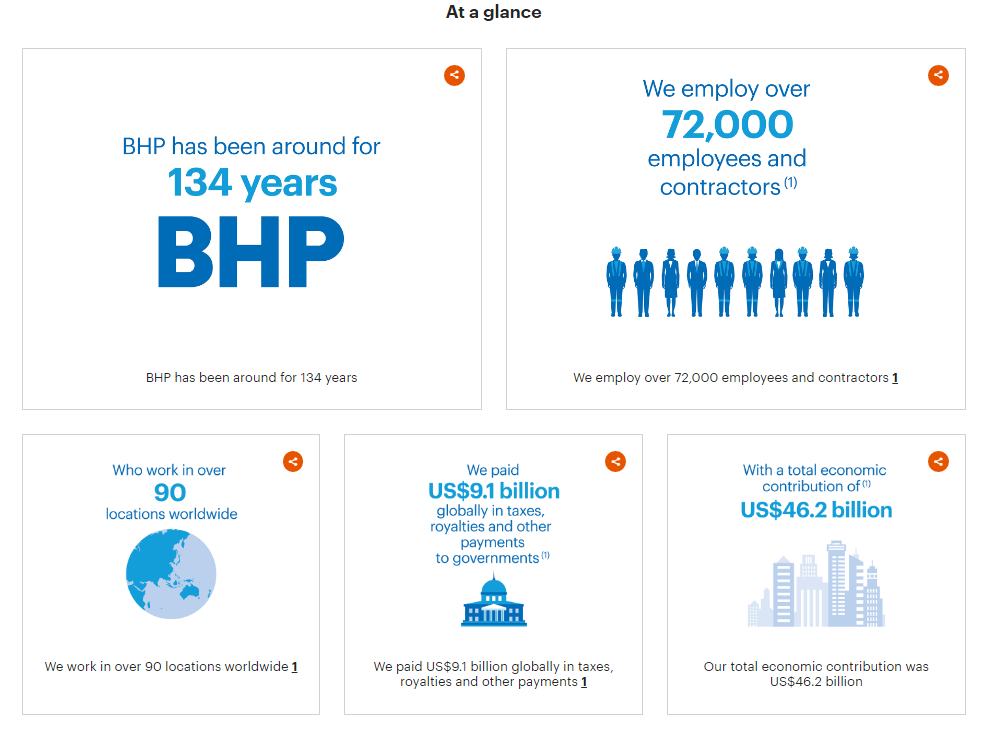
Figure 1. BHP 2019 performance and highlights
b) Analysis of company net working capital position
Financial statements are basically of three forms i.e. balance sheet, income statement and statement of owner equity. Balance Sheet is one which tell us about the company’s financial condition that how is the performance of the company. Here the financial analysis also based on the different financial ratios that are calculated using balance sheet data.
One of the indictors for financial measure is net working capital. It is the instrument used to check that the company's current assets will cover its current liabilities. It tells us about the firm's soundness and lenders can assess a firm's potential to pay back its obligations within a year. NWC is the instrument of liquidity that achieve short-term requirements and other financial goals.
- The positive value of NWC illustrates that current assets are greater than current liabilities.
- The negative value of NWC illustrates that current assets are less than current liabilities.
The positive value of NWC is the sign that company has enough currents assets that it can pay its all current obligations and still save some amount. Whereas when NWC has negative value, it demonstrates that company has insufficient current assts to meet its current obligations and the risk of solvency also increases in this case. Below is the formula of NWC:
Read More
Net Working Capital = Current Assets – Current Liabilities
Table 1. Net Working Capital
|
Years
|
2019
|
2018
|
| |
US$m
|
US$m
|
|
Current Assets
|
23373
|
35130
|
|
Current Liabilities
|
12339
|
13989
|
|
Net Working Capital
|
11034
|
21141
|
Table 1 of net working capital shows that the amount of the NWC decreases from 2018 to 2019. Both current assets and current liabilities decreases from 2018 to 2019. The result indicates that short-term funds obtain from current assets during the year 2019 are lower to meet the current liabilities as comparison to the year 2018.
Graph 1.
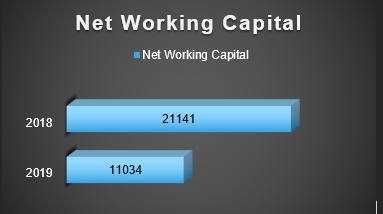
Graph 1 shows the pictorial representation of the net working capital of BHP for year 2018 and 2019. There are several issues that may arises based on current assets and current liabilities therefore, there is a need that BHP maintain certain amount of current assets and current liabilities to accomplish the working capital management and reduces the chances of liquidity risk.
c) Calculation of cost of equity of the firm
Based on the “Annual Report 2019” of BHP, the paid dividend (D0) of BHP is US$1.137 and the current share price (P0) is 39.10. BHP will maintain a constant dividend growth rate of 3% from now on, so the cost of equity of BHP is calculate by using constant dividend growth model.
Below are the calculations of cost of equity (RE) of BHP:
RE = D0 * (1+g) / P0 + g
RE = 1.137 * (1+ 0.03) / 39.10 + 0.03
RE = 1.171 / 39.10 + 0.03
RE = 0.0599
RE = 5.99%
The cost of equity of BHP is 5.99% so as a company BHP has to earn 5.99% to satisfy the equity holdings of the company. A company uses equity costs to determine the riskiness of investments, including both internal ventures and prospects for external acquisitions. Businesses usually use a mixture of equity and debt funding, with equity more costly.
d) Analysis of company liquidity and capital structure using liquidity and capital structure ratios
Liquidity ratios
Liquidity is a concept that states to the capacity of the business to pay back its short-term obligations. Liquidity ratio involves current assets that are cash and cash equivalents, marketable securities and short-term trade receivables. The accessibility of these resources allows the firms to make short-term investments that can reinforce the overall financial position (Raghavan & Mishra, 2011). The high value of liquidity ratios indicates the capacity to meet its obligations in a given small time. Furthermore, the larger the ratio, the smaller the credit risk, which is the risk of default for the firm. Liquidity ratios are important in terms of evaluating the potential of loan customers.
Two most common types of liquidity ratio are the current ratio and the operating cash flow ratio.
i. Current Ratio
The current ratio is one category of liquidity ratio which assesses the potential of a firm to pay off its short-term obligations with its current assets. The current ratio is a significant liquidity indicator considering that short-term liabilities are accrued by next year. That shows a company has a small amount of time to fund the project to compensate for such obligations. Below is the formula of current ratio:
Current Ratio = Current Assets / Current Liabilities
Table 2. Current Ratio
| |
2019
|
2018
|
2017
|
2016
|
| |
US$m
|
US$m
|
US$m
|
US$m
|
|
Current Assets
|
23373
|
35130
|
21056
|
17714
|
|
Current Liabilities
|
12339
|
13989
|
11366
|
12340
|
|
Current Ratio
|
1.89
|
2.51
|
1.85
|
1.44
|
Table 2 represents the current ratio of BHP for the year 2016 to 2019. It is indicated that the current ratio in year 2019 is low as compared to year 2018. From the above table it is quite clear that for every US$ 1.0 of its current liabilities, the year 2019 has US$ 1.89 of current assets. Moreover, if consider 4-year time period from 2016 to 2019 then the year 2018 is the most liquid in terms of paying its liabilities.
Graph 2.
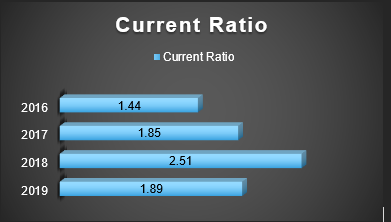
Graph 2 shows the pictorial representation of the current ratio of BHP for year 2016 to 2019.
ii. Quick Ratio
The quick ratio demonstrates a firm’s capacity by using its liquid assets to fulfills short-term business requirements. It is like current ratio but is regarded as a more useful measure of the short-term creditworthiness of a business. Quick ratio comprises of cash, marketable securities and accounts receivables as the current assets and inventory is not part of current assets.
Below is the formula of quick ratio:
Quick ratio = (Cash + Marketable securities + Accounts receivable) ÷ Current liabilities
Table 3. Quick Ratio
| |
2019
|
2018
|
2017
|
2016
|
| |
US$m
|
US$m
|
US$m
|
US$m
|
|
Quick Assets
|
19075
|
18967
|
16989
|
13474
|
|
Current Liabilities
|
12339
|
13989
|
11366
|
12340
|
|
Quick Ratio
|
1.55
|
1.36
|
1.49
|
1.09
|
Table 3 shows the quick ratio values of BHP for the period ranges from 2016 to 2019. The quick ratio is quite good in 2019, it is clear that year 2019 has US$1.55 of quick assets for each US$1.0 of its current liabilities. However, 2016 seems least liquid in all last four year of quick ratio calculations, this shows that it is bit less liquid while paying its liabilities. Quick ratios are most often described as indicators of a firm's willingness to pay its current debt obligations without depending on inventory sales. This ratio is very useful in retail and development settings where large proportion of current assets can be kept.
Graph 3.
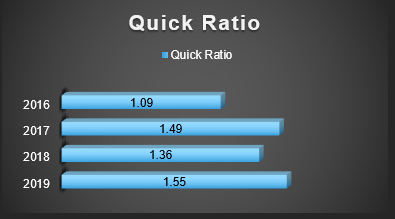
Graph 3 depicts the pictorial representation of the quick ratio of the BHP.
Capital structure ratios
Companies that rely more on capital financing as compare to debt financing shows a much good results in terms of growth and progress. The reason is that companies with high capital financing contribute in better investment opportunities and high profitability. Cassar and Holmes (2003) argued that elements such as productivity, asset structure and development are significant factors affecting a corporation's capital structure; nevertheless, the corporation's size and risk have negligible consequences on its capital structure. The capital structure ratios can be described as the financial ratios that assess the company's long-term stability and structure. Both ratios reflect the combination of funds made available by owners and borrowers and guarantee long-term fund. These ratios offer additional understanding into the financing tactics the business uses, and emphasis on the role of long-term soundness.
There are two main ratios that are calculated to analyze the capital structure of the business concern.
i. Debt-Equity Ratio
The debt-equity ratio is a capital structure ratio which combines the total debt of a business with the total equity. The debt-equity ratio illustrates the percentage of corporate funding coming from both creditors and investors. A greater debt-to-equity ratio shows high borrower funding than investor funding. The Debt-equity ratio exams creditors' and owners' claims against the company's assets. This is used to measure the relationship between the outsider’s fund and internal equity fund. It's a long-term, solvency tool. Below is the formula of debt equity ratio.
Debt Equity Ratio = Total Liabilities / Shareholders’ Equity
Table 4. Debt-Equity Ratio
| |
2019
|
2018
|
2017
|
2016
|
| |
US$m
|
US$m
|
US$m
|
US$m
|
|
Total Liabilities
|
49037
|
51323
|
54280
|
58882
|
|
Total Shareholders' Equity
|
51824
|
60670
|
62726
|
60071
|
|
Debt-Equity Ratio
|
0.95
|
0.85
|
0.87
|
0.98
|
The debt-equity ratio for year 2019 is US$ 0.95. This shows that for every dollar of BHP owned by the shareholders, BHP owes US$ 0.95 to creditors. A lower debt-equity ratio generally means a more financially stable company. Businesses with higher debt-to-equity ratios are regarded riskier for creditors and investors than lower-ratio companies. The high ratio means that the claims of outsiders are more than the owner. Hence, the higher the ratio, the greater the creditors ' risk will be, telling too much reliance on long-term debt. On the contrary, low ratio safeguard the businesses.
Graph 4.
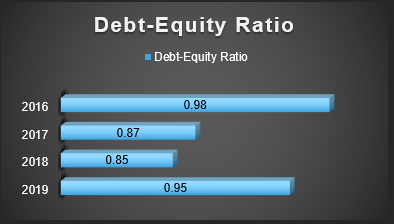
Graph 4 shows the pictorial representation of the debt-equity ratio of BHP.
ii. Debt to Asset Ratio
The debt to assets ratio is another capital structure ratio that measure the financial leverage for a company. This tells us the proportion of the total assets of a firm that were part of investors financing. In addition, it is the total sum of the liabilities of a company divided by the total assets of that company. The debt to asset ratio is mainly help the investors and creditors to evaluate the risk of the business. High value of debt-asset ratio shows high leverage of company and this indicates the riskiness of the company and vice versa.
Following is the formula of debt to asset ratio:
Debt to Asset Ratio = Total Debts / Total Assets
Table 5. Debt-Asset Ratio
| |
2019
|
2018
|
2017
|
2016
|
| |
US$m
|
US$m
|
US$m
|
US$m
|
|
Total Liabilities
|
49037
|
51323
|
54280
|
58882
|
|
TOTAL ASSETS
|
100861
|
111993
|
117006
|
118953
|
|
Debt-Asset Ratio
|
0.49
|
0.46
|
0.46
|
0.50
|
Table 5 indicates the Debt to asset ratio of the BHP for the year 2016 to 2019. There is a consistence trend of debt-asset ratio from last three years. The ratio is quite low and this is a healthy sign for BHP. There are 49 % of the BHP's assets being funded by creditors in the year 2019, and owners are providing 51 % of the cost of the assets. The high value of debt-asset ratio shows that there are high financial leverage and more risk. A ratio greater than 1 indicates that significant portion of the assets are debt-funded and face high risk of default.
Graph 5.
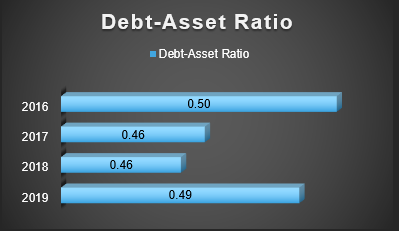
Graph 5 indicates the pictorial representation of the debt-asset ratio of the BHP.
RECOMMENDATION AND CONCLUSION
Following are few recommendations for the better financial performance of the BHP and attract the potential investors.
- The BHP should increase its current assets because current ratio decreases from year 2018 to 2019 in order to attract more investors. So, BHP need to main the liquid funds like cash and cash equivalents.
- The BHP should work in the domain of capital structure management in order to seek more potential investors as debt to equity ratio for the year 2019 is US$ 0.95.
The BHP is the trading entity. The financial analysis has set out the basic trends and financial ratios of the BHP. The above calculations explain that the net working capital of BHP in year 2019 is low as compare to year 2018 which is bit alarming for BHP. In addition, BHP has earned 5.99% of cost of equity that satisfy the equity holding of the BHP. In terms of liquidity, 2019 seems to be less liquid year for BHP as current ratio have smaller values in comparison with last years. Whereas capital structure of BHP seems pretty impressive as both ratios i.e. debt-equity ratio and debt-asset ratio for year 2019 have smaller values which is good for growth of BHP. BHP is leading name in the world in terms of trading entity. Although BHP have good financial position but liquidity ratios are bit smaller in value but overall BHP is in good financial state in terms of working capital management.
REFERENCE
BHP, n.d.a. ‘Our Business’. Retrived [28 January 2020]. Retrived from https://www.bhp.com/our-businesses/
BHP, n.d.b. ‘Our cmpany. About us’. Retrived [28 January 2020]. Retrived from: https://www.bhp.com/our-approach/our-company/about-us/
BHP, n.d.c. ‘Our company. Our story’. Retrived [28 January 2020]. Retrived from: https://www.BHP.com/our-company/our-story.
Cassar, G. and Holmes, S., 2003. Capital structure and financing of SMEs: Australian evidence. Accounting & Finance, 43(2), pp.123-147.
Listcorp, n.d. ‘News’. Retrived [29 January 2020]. Retrived from: https://www.listcorp.com/asx/bhp/bhp-group-limited#news
Raghavan, N.S. and Mishra, V.K., 2011. Short-term financing in a cash-constrained supply chain. International Journal of Production Economics, 134(2), pp.407-412.


