
Report on GDP per capita and Average life satisfaction
1) Purpose:
The purpose of this report is to identify the association between the GDP per capita and average life satisfaction. It also helps the readers to analyze how GDP per capita influence the average life satisfaction by demonstrating the scattered diagram. It also develops the regression equation based on the two variables; GDP per capita and average life satisfaction. And it helps the reader to identify why economists interested in this specific issue.
2) Background:
GDP is an acronym of Gross Domestic Product and it can be defined as the total value of all services and goods that are produced within a country's boundary in the period of 1 year. The GDP per capita is not considered as the perfect measure, but it is the best single measure of the average life satisfaction in the country. It is not because material goods are the important goods but the real GDP is inter-linked with many other co-related aspects that we usually think about (Johnston, & Williamson, 2008). For instance; life expectancy, there is a positive relationship between the GDP per capita and the life expectancy. Countries that belong to the highest GDP per capita, also have the greatest life expectancy. Another example is happiness, and again there is a positive correlation between the GDP per capita and happiness. Countries that have the highest GDP per capita, the people of these countries tend to be happier (Carroll, Frijters, & Shields, 2009). The simple story is when we have more services and goods, we can usually afford other goods as well. However, the GDP measure is not a perfect measure as it does not involves the income distribution. For instance, by considering the three countries; Nigeria, Pakistan and Honduras. These countries have the same GDP per capita so these countries might have the same average living satisfaction. But in Nigeria, 80% of the population has only $2 to spend in a day. In Pakistan, its 60% and in Honduras its only 33%. The number of people living in poverty is different even if there is a similar GDP of these three countries. And this is because in comparison of the three countries, in Nigeria the income is much more unequally distributed than in Pakistan and Honduras. Nigeria has many poor people but there are rich people as well, so the average income of the three countries is the same. Therefore the growth in the real GDP per capita results in the increase of income, even of the poor people. So the real GDP per capita is the perfect measure to identify the average life satisfaction and this is the reason because of which economists are more interested in this particular issue (Ovaska, & Takashima, 2006).
3) Method:
This report is written on the basis of authentic literature review, and the research articles that have been written by well-known economists. The data used in this research has been collected from many different countries to identify the relationship between the GDP per capita and the average life satisfaction, taken the GDP per capita as the independent variable whereas the average life satisfaction is considered as the dependent variable. Concerning to the given data the annual GDP per capita of the three countries such as; Greece, Turkey and Latvia is $24,076.69, $24,915.17 and $24,092.42 respectively whereas the average life satisfaction is 5.2, 5.5 and 5.9 respectively. In accordance with the concerning data, there is a positive relationship between the GDP per capita and the average life satisfaction. Increase in GDP per capita will increase the average life satisfaction. However, comparing to the data of these three countries there is a difference between the average life satisfaction whereas the GDP per capita is approximately the same. The difference in average life satisfaction is due to the income distribution, as GDP does not include the distribution of income (Carroll et al., 2009). This means Latvia focus more on equal distribution of income than Greece and Turkey. Overall, the whole scenario demonstrates the positive relationship between average life satisfaction and the GDP per capita.
4) Results:
GDP is considered as an independent explanatory variable whereas the average life satisfaction is the dependent or responsive variable. Life satisfaction is considered as the measurement of how people estimate their life as a whole rather than on the basis of their current satisfaction and feeling (Johnston, & Williamson, 2008). Concerning to the given data Turkey, Greece and Portugal have a low level of average life satisfaction having an average level of 5.5, whereas countries like; Finland, Norway, Iceland, Switzerland and Denmark reaches the score of 7.5. On the other hand, the lowest GDP per capita is of Mexico that is $17,122.53 whereas Luxembourg having the highest GDP per capita that is $86,788.14.
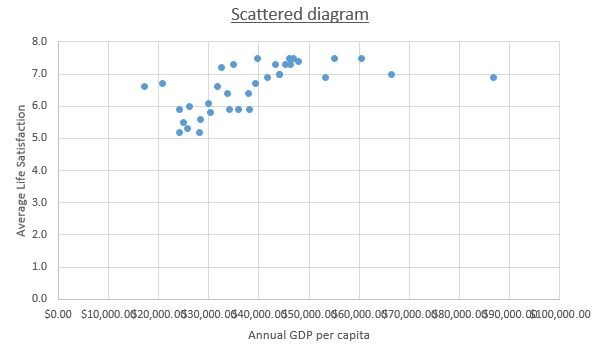
The above-scattered diagram shows the positive relationship between the annual GDP per capita and Average Life Satisfaction. As we can see that the points are grouped together that means there is an association between the two variables. As the GDP per capita increases, it will increase the average life satisfaction. Though there are some points where Annual GDP is increasing it does not have a large impact on average life satisfaction because of the unequal income distribution. Unequal distribution of money leads to less satisfaction life (Carroll et al., 2009).
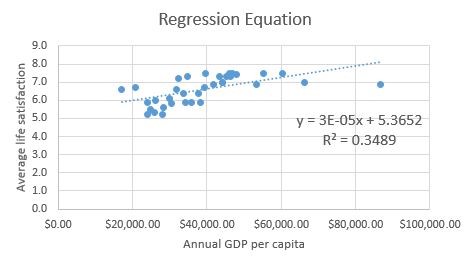
Considering the above diagram, the regression equation is y=3-05x + 5.3652. Since the trend-line of the given data is linear and it is in an upward direction so it demonstrates the positive relationship between the annual GDP per capita and the average life satisfaction.
To make the overall concept of the regression equation much easier we can multiply the coefficient of x by 10000 so the equation becomes y = 0.3x + 5.3652. Now, this equation interprets that the increase in $1000 of annual GDP per capita it increases the 0.3 of the average life satisfaction scores. And it shows that the y-intercept is positive, and this is true if we follow the line that is in an upward direction.
The above graph shows the statistically significant relationship between the average life satisfaction and the annual GDP per capita, having a correlation of 0.59 between them. The increase in $1000 of annual GDP per capita results in an increase of 0.3 of average life score. As a concluding statement, Annual GDP per capita has an impact on average life satisfaction, but the impact can be seen more clearly if countries try to focus more on a fair distribution of income (Johnston, & Williamson, 2008)
A good fit can be defined as the line that is the result of scattered points shows the relationship between the two variables. The above regression equation can be considered as a good fit because the graph shows the positive straight line, having the impact of annual GDP per capita on the average life satisfaction scores with the correlation of 0.59.
Read More


Get Assignment Help from Me

